Contents
8. Create layers
![]() Updated
by Mapidea Team
Updated
by Mapidea Team
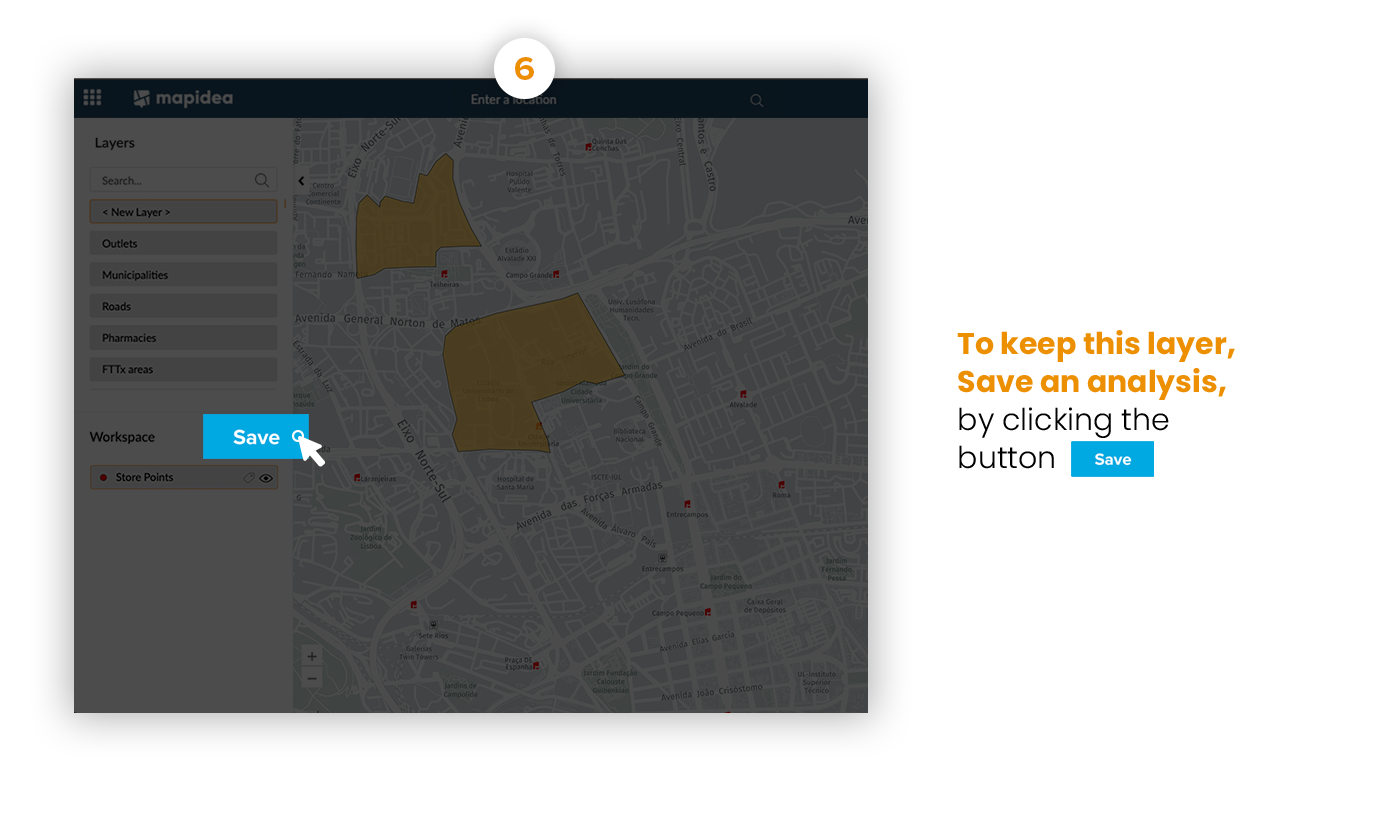
It's possible to add new data by dragging & dropping "new layer" to the map. The layer can be drawn on the map (either points, lines or areas) or can be created from an outside file.
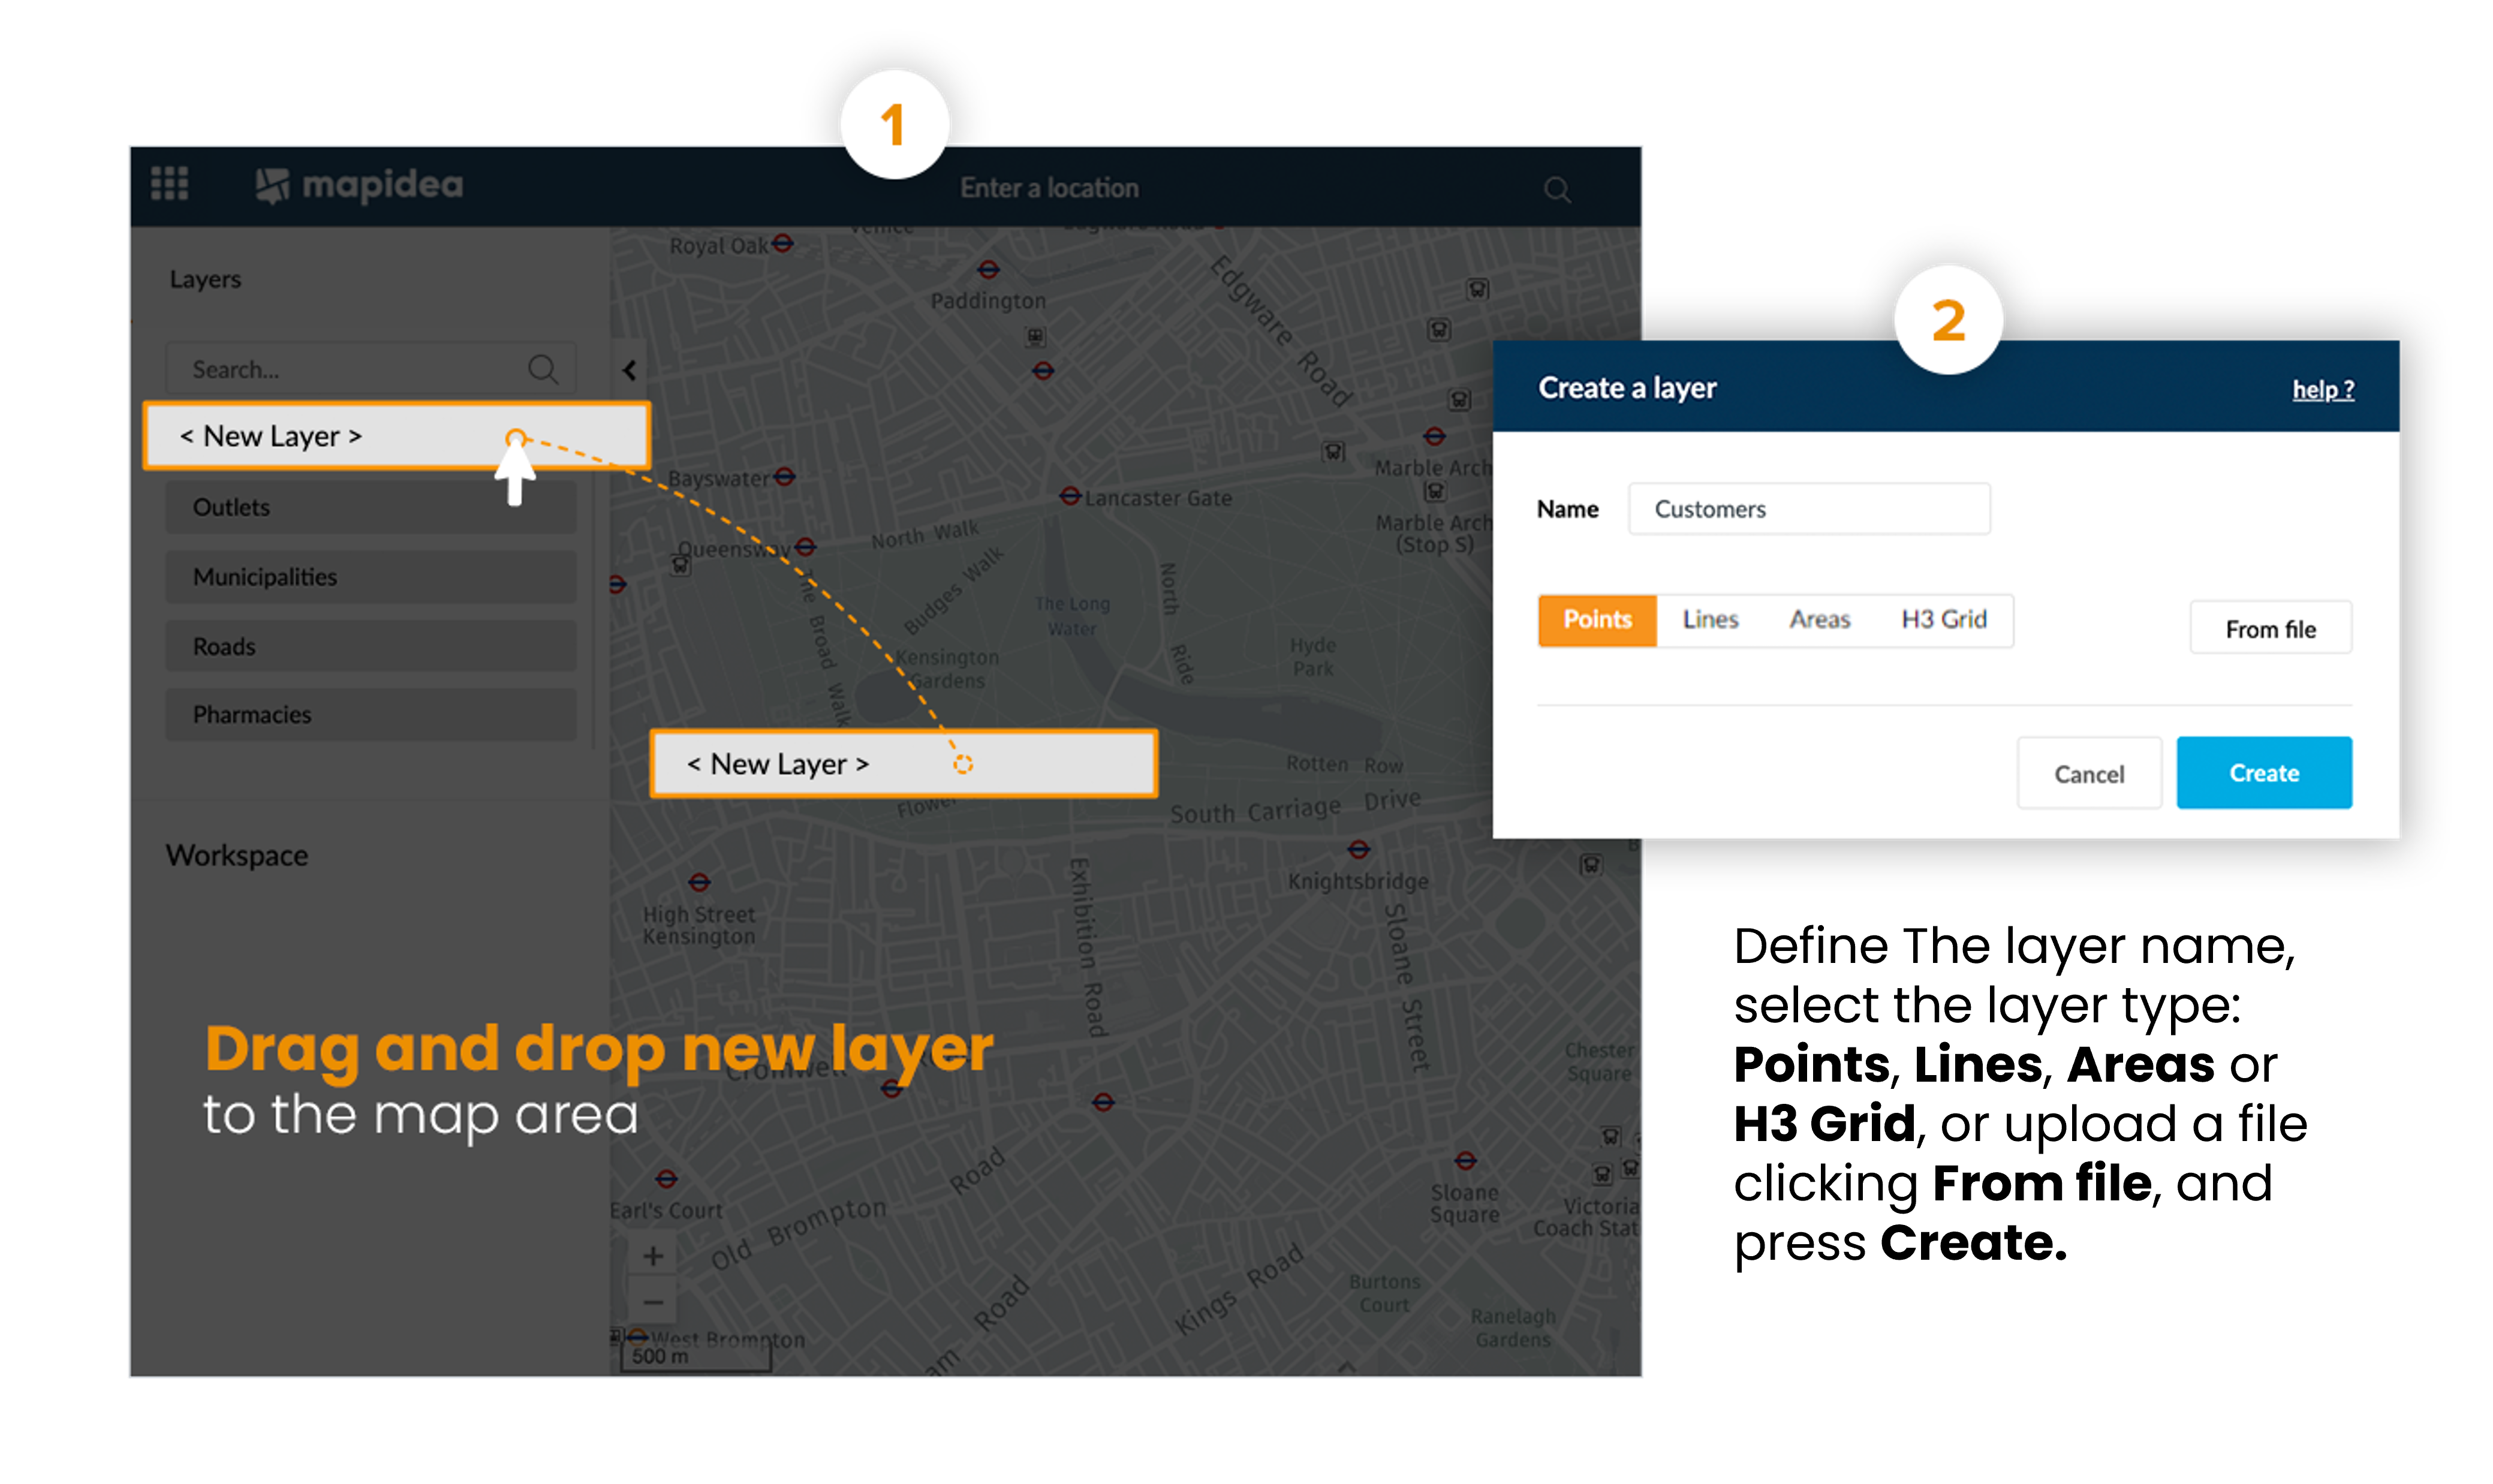
8.1 Points
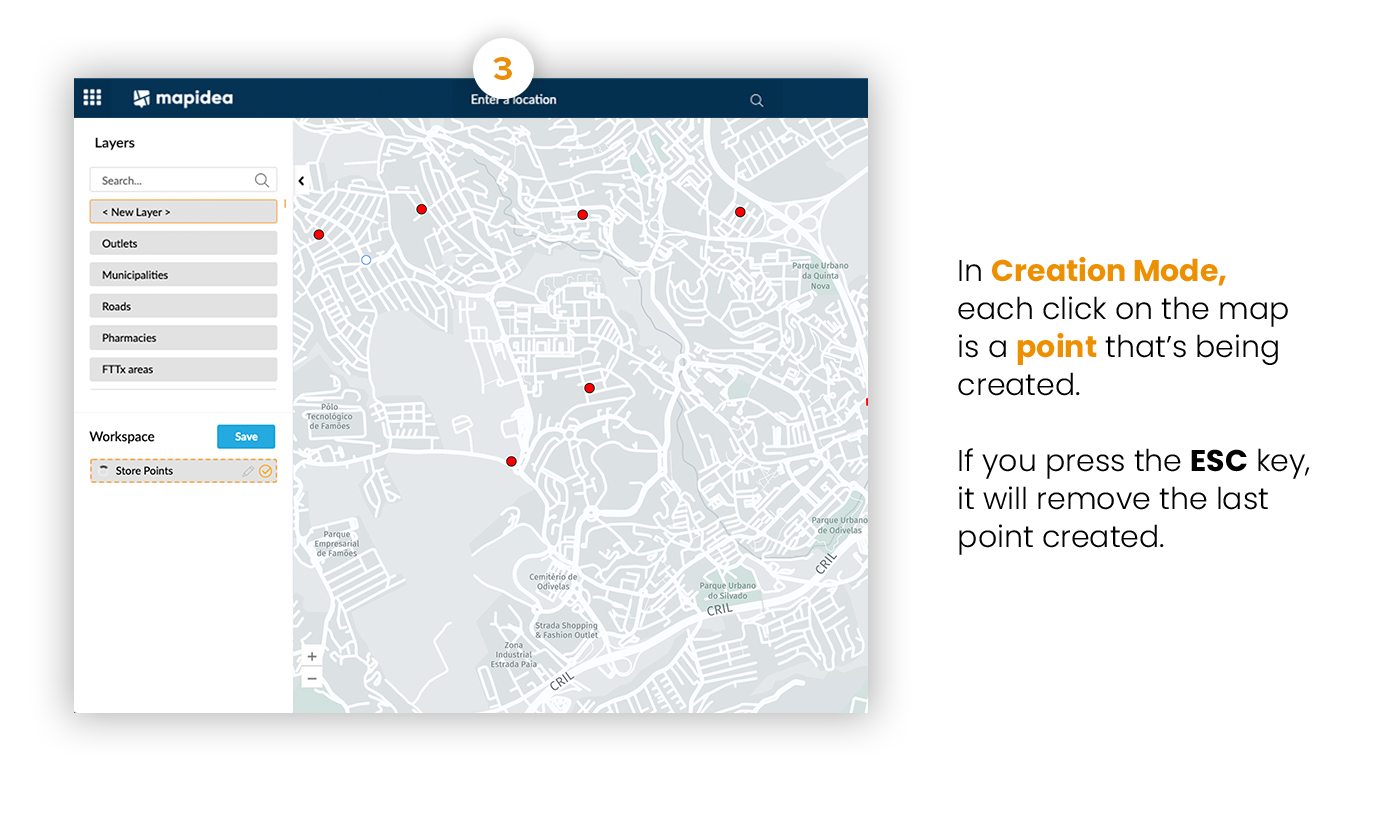
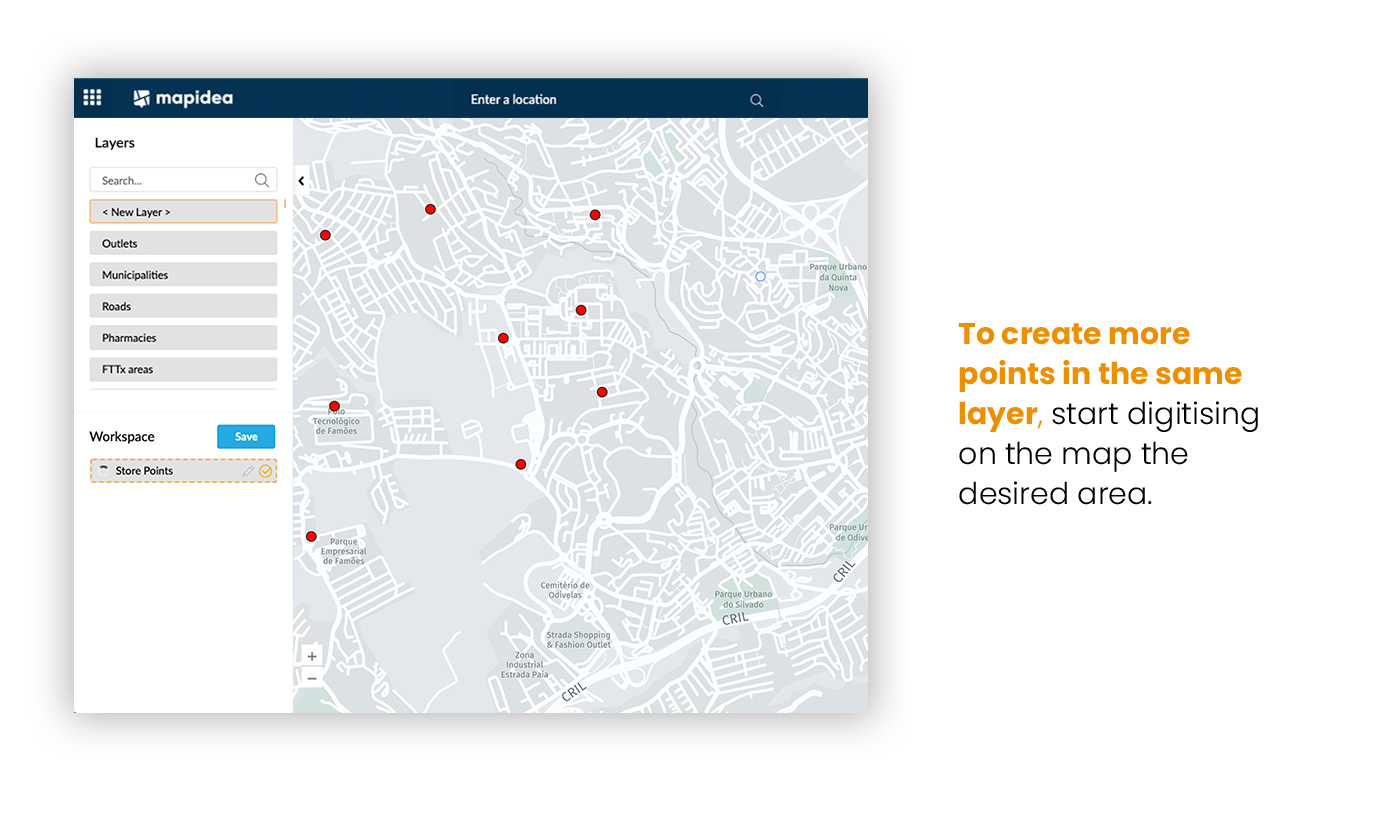
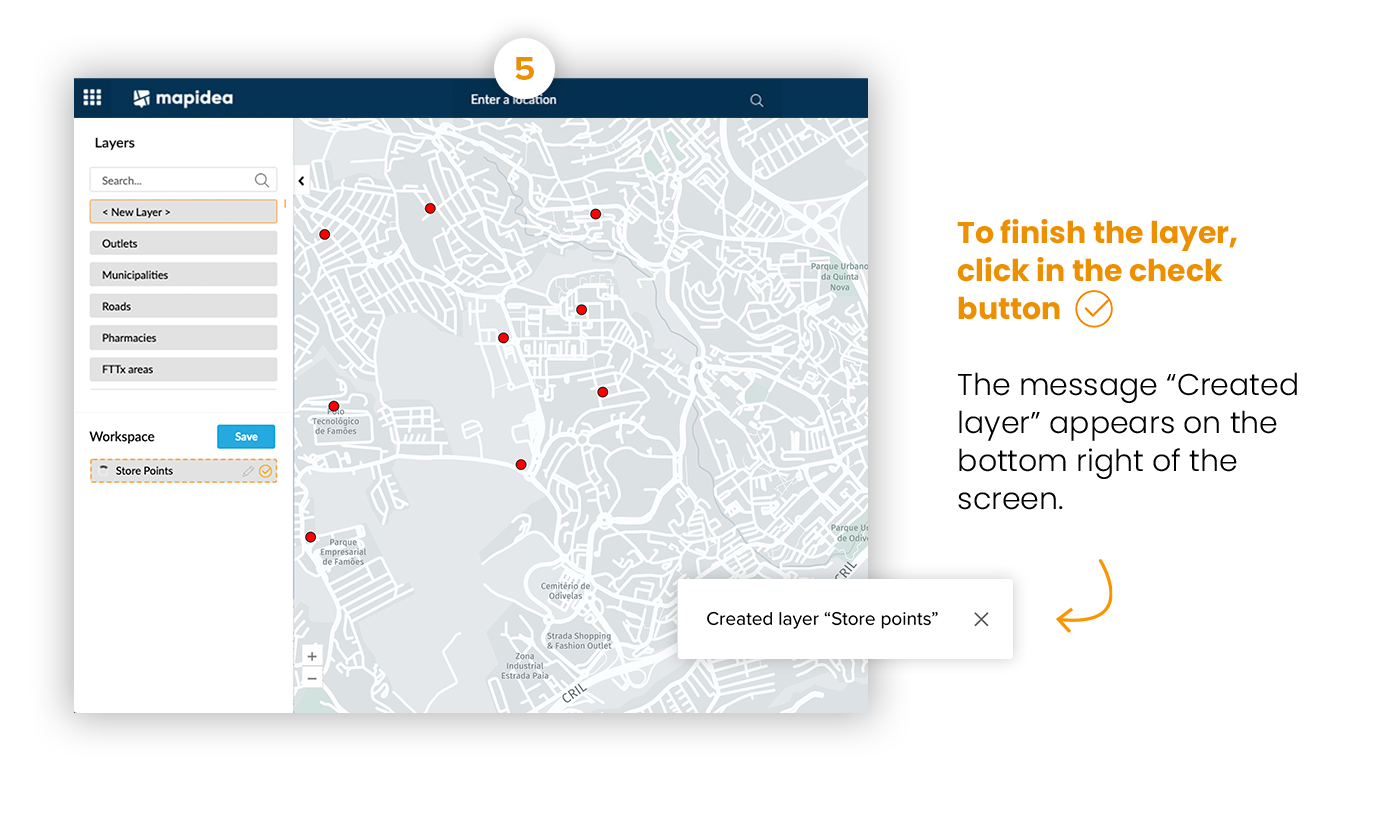
The created layer appears in the Analysis list in creation mode. To create points, start digitising on the map.
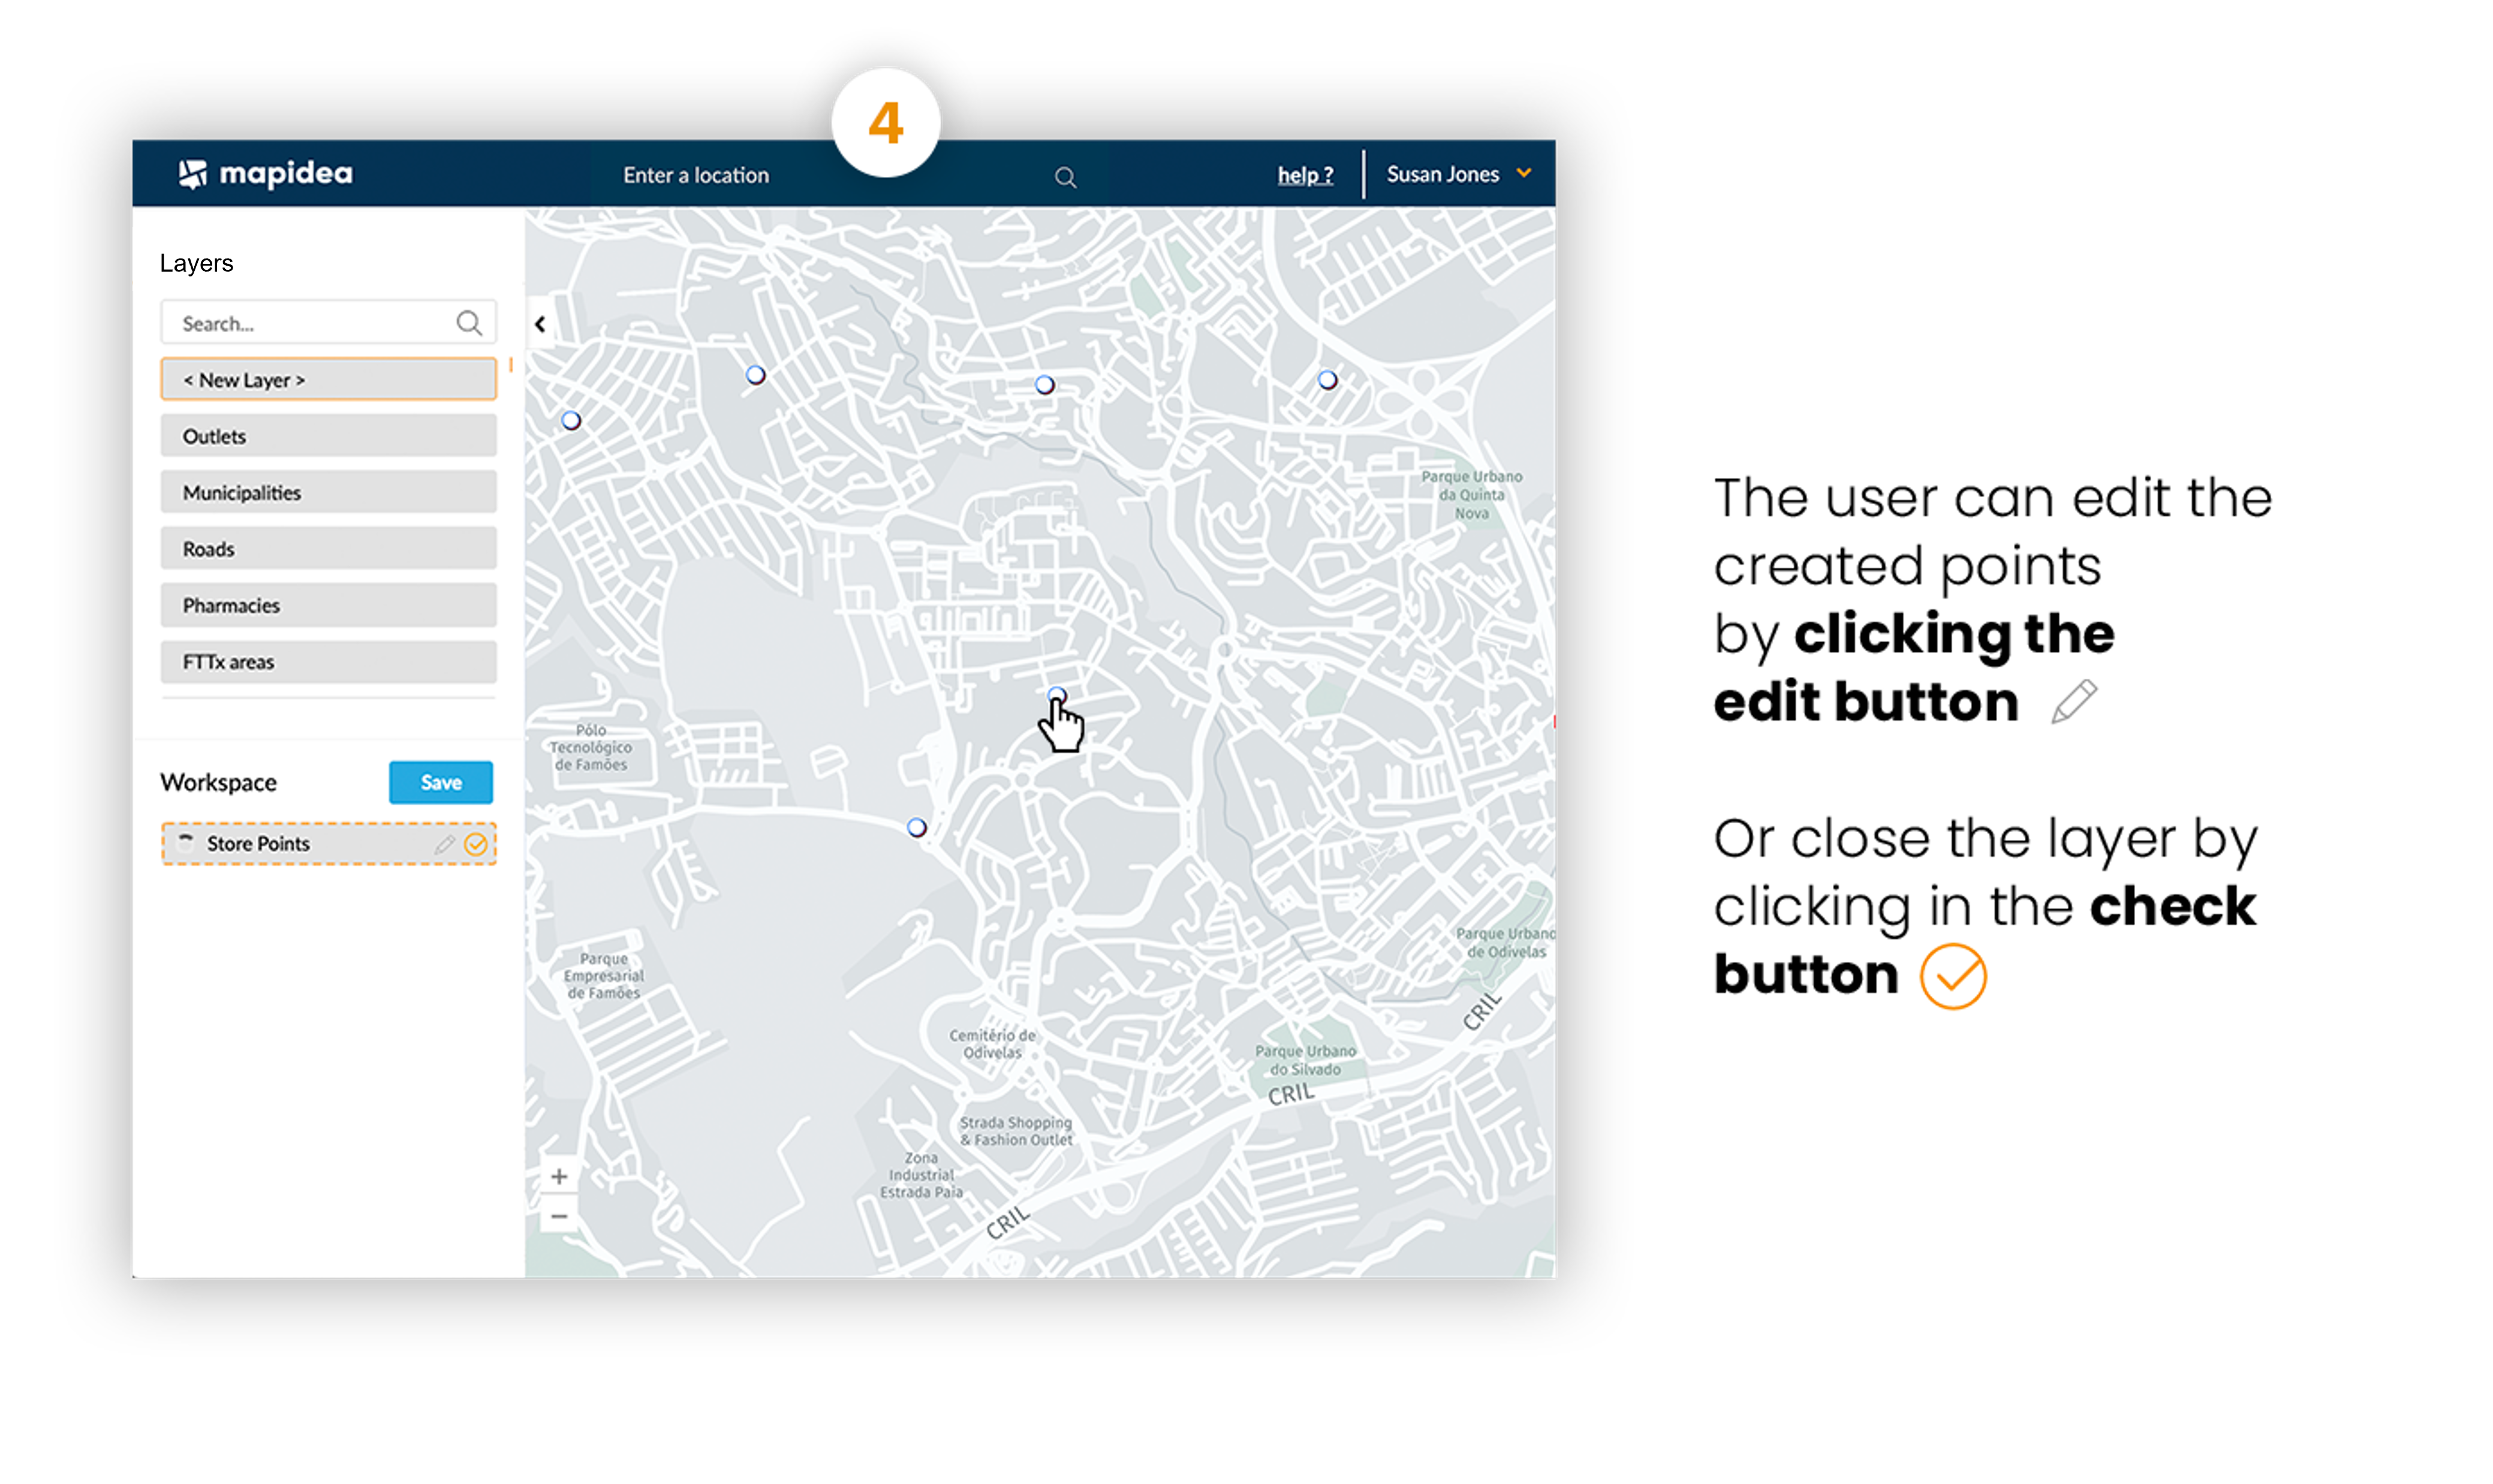
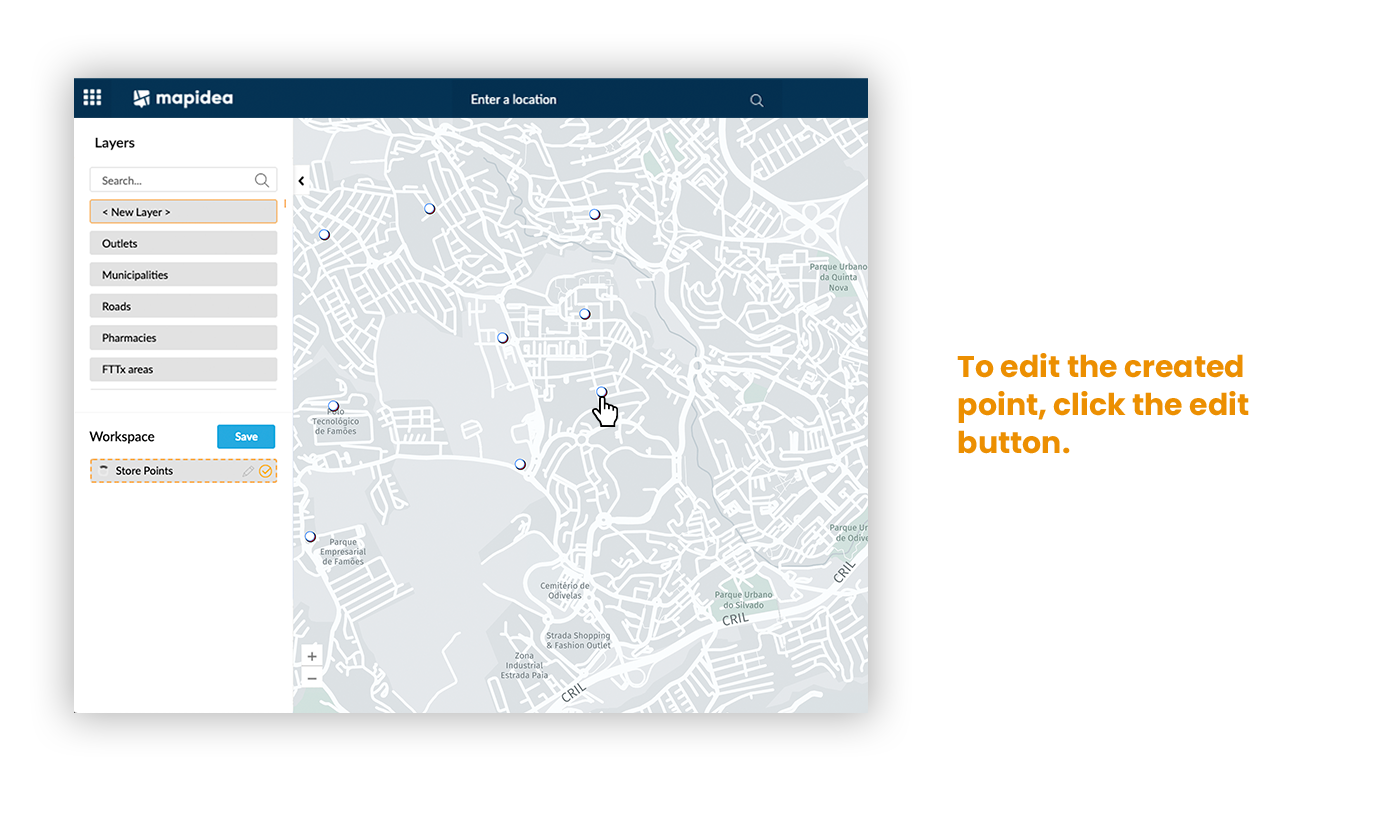
In Editing mode the user can move the point or delete it using right mouse click
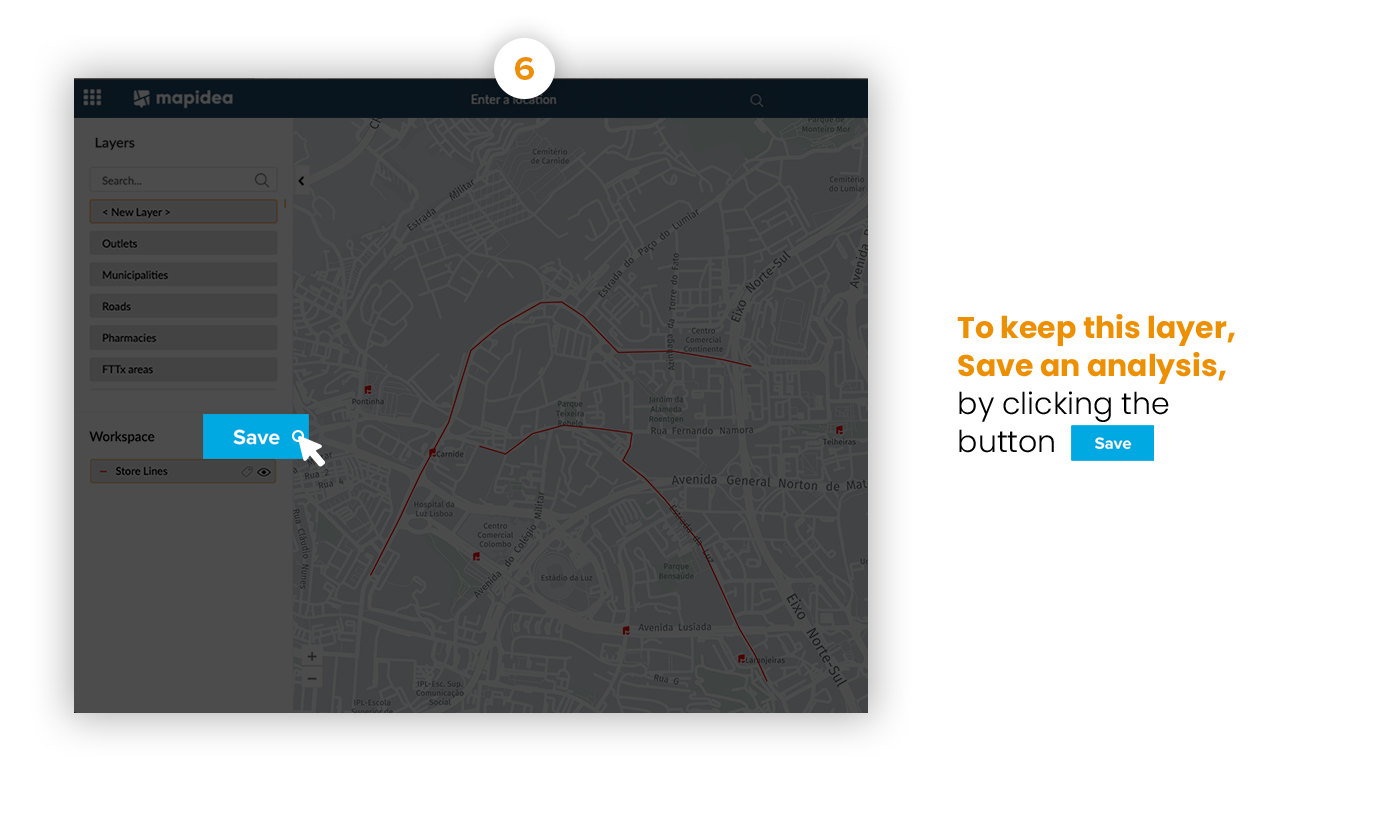
8.2 Lines
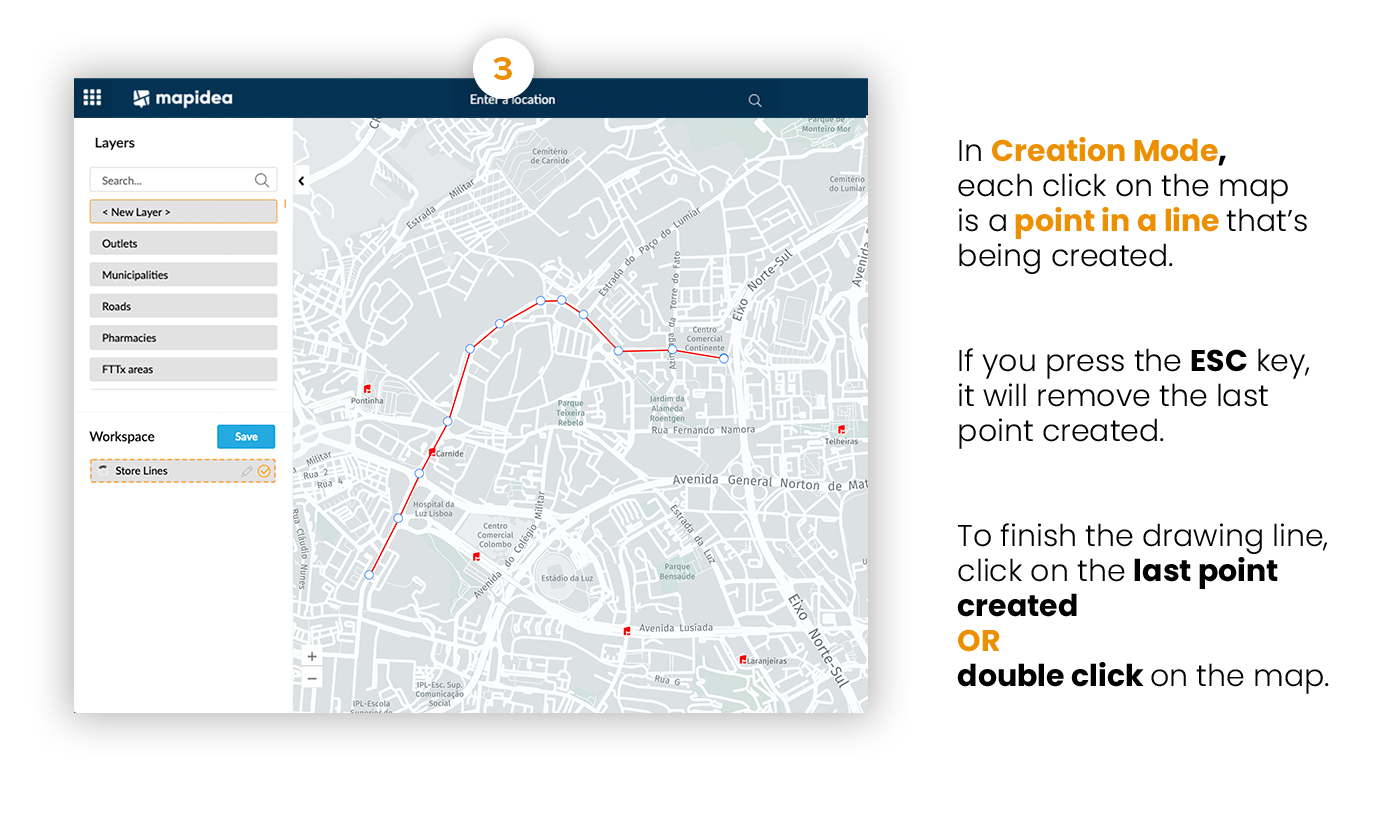
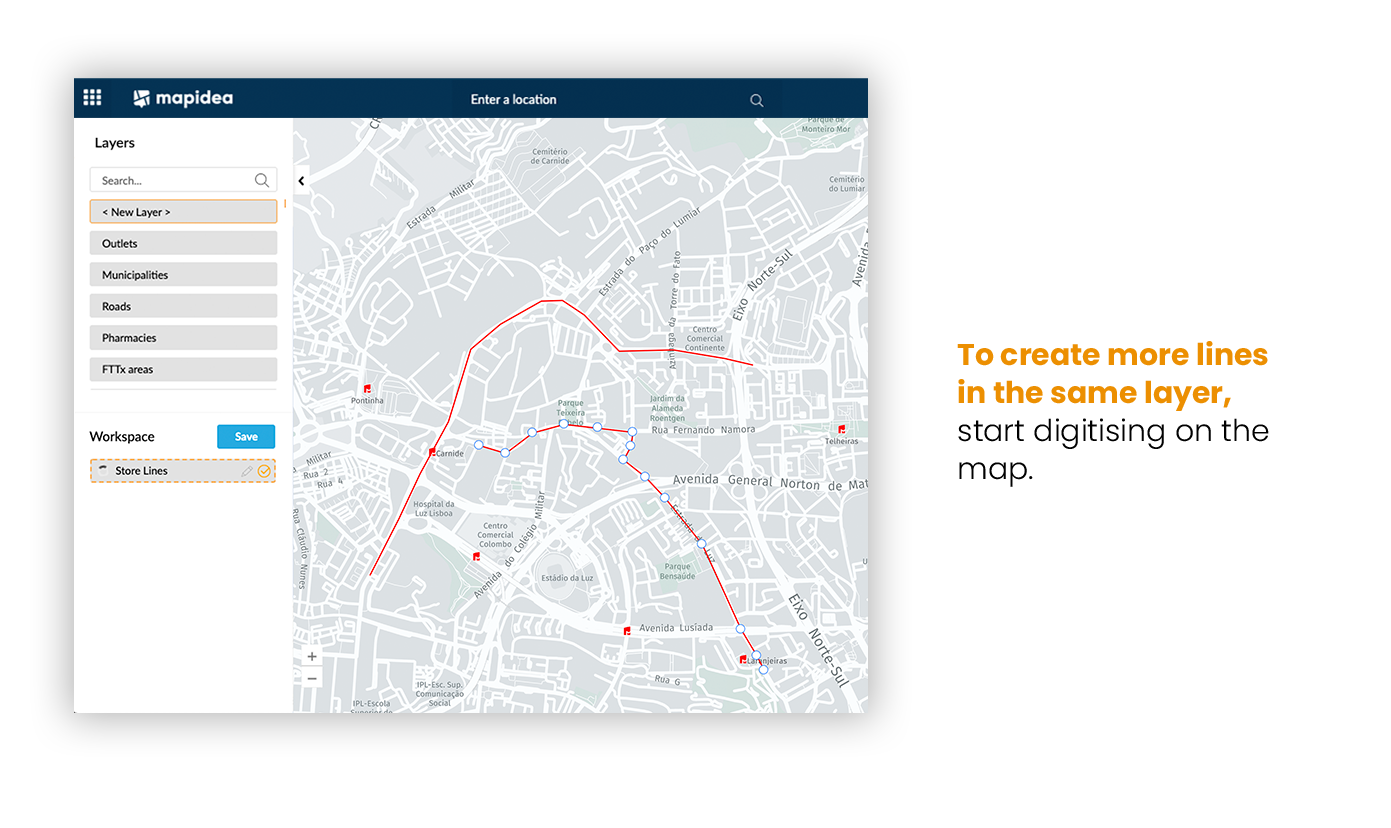
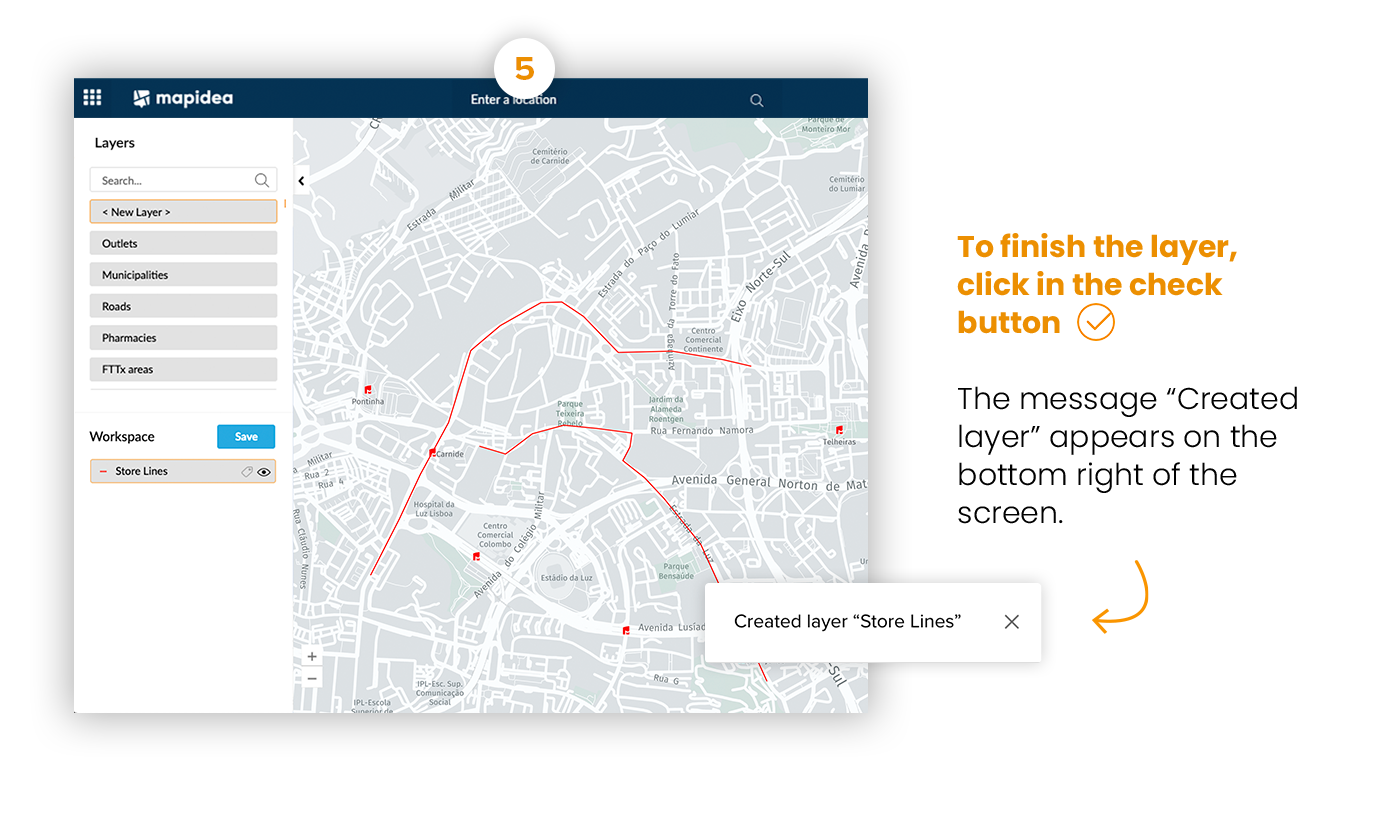
The created layer appears in the Analysis list in creation mode.
To create lines, start digitising on the map the desired area.
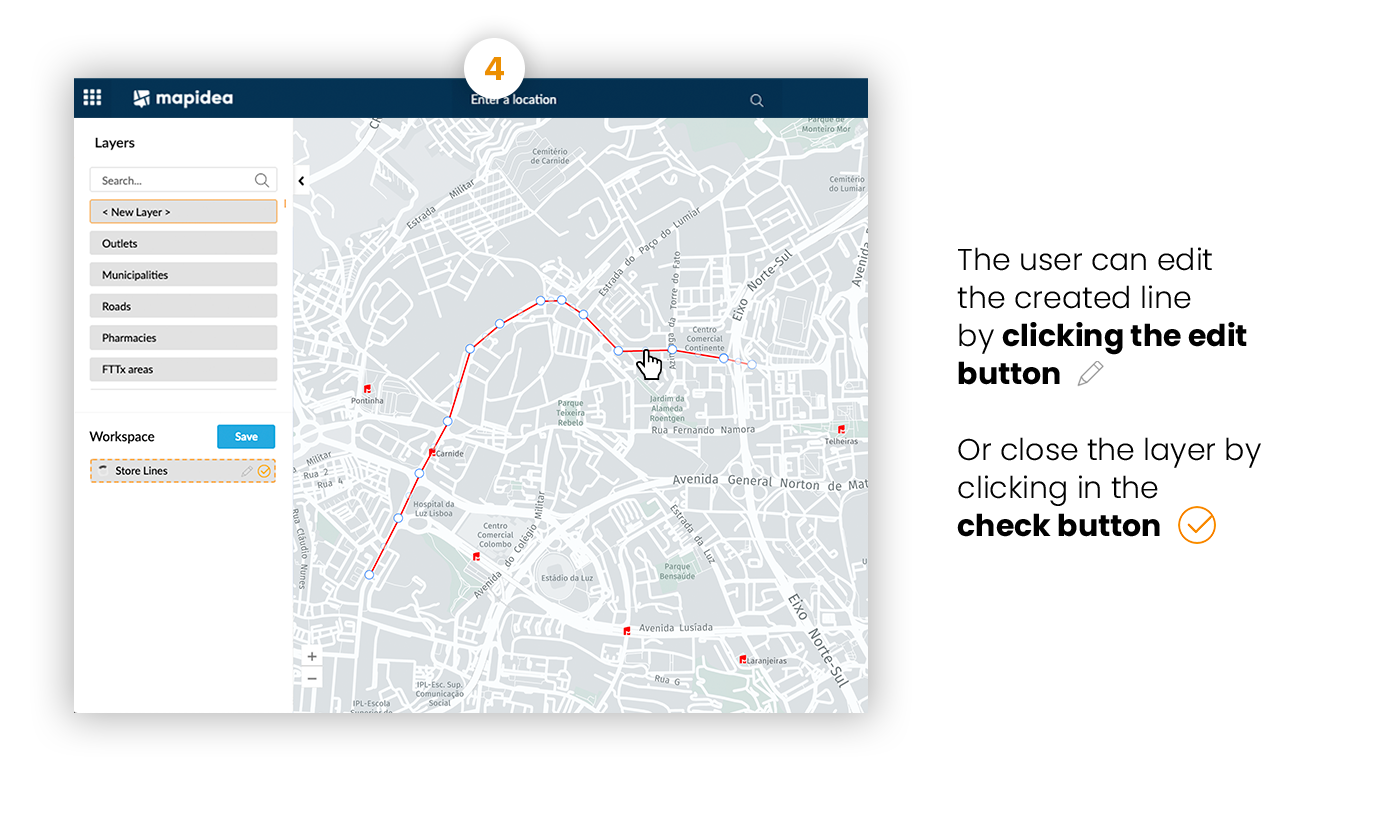
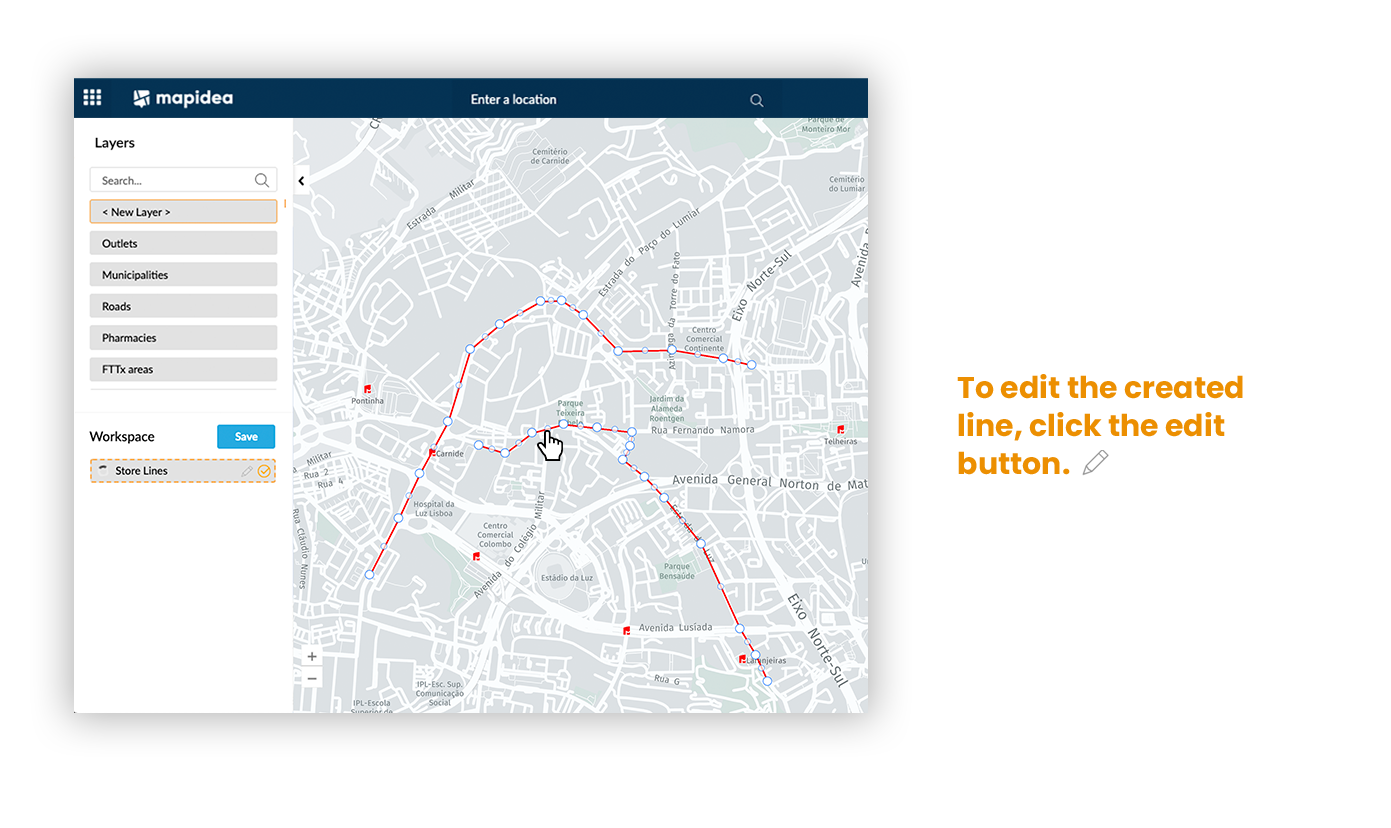
In Editing mode the user can:
1. Move points by dragging & drop to the desired location;
2. Create new points by clicking in the “placeholders”; then drag & drop to desired location. Everytime a point is created, a new “placeholder” is created in between.
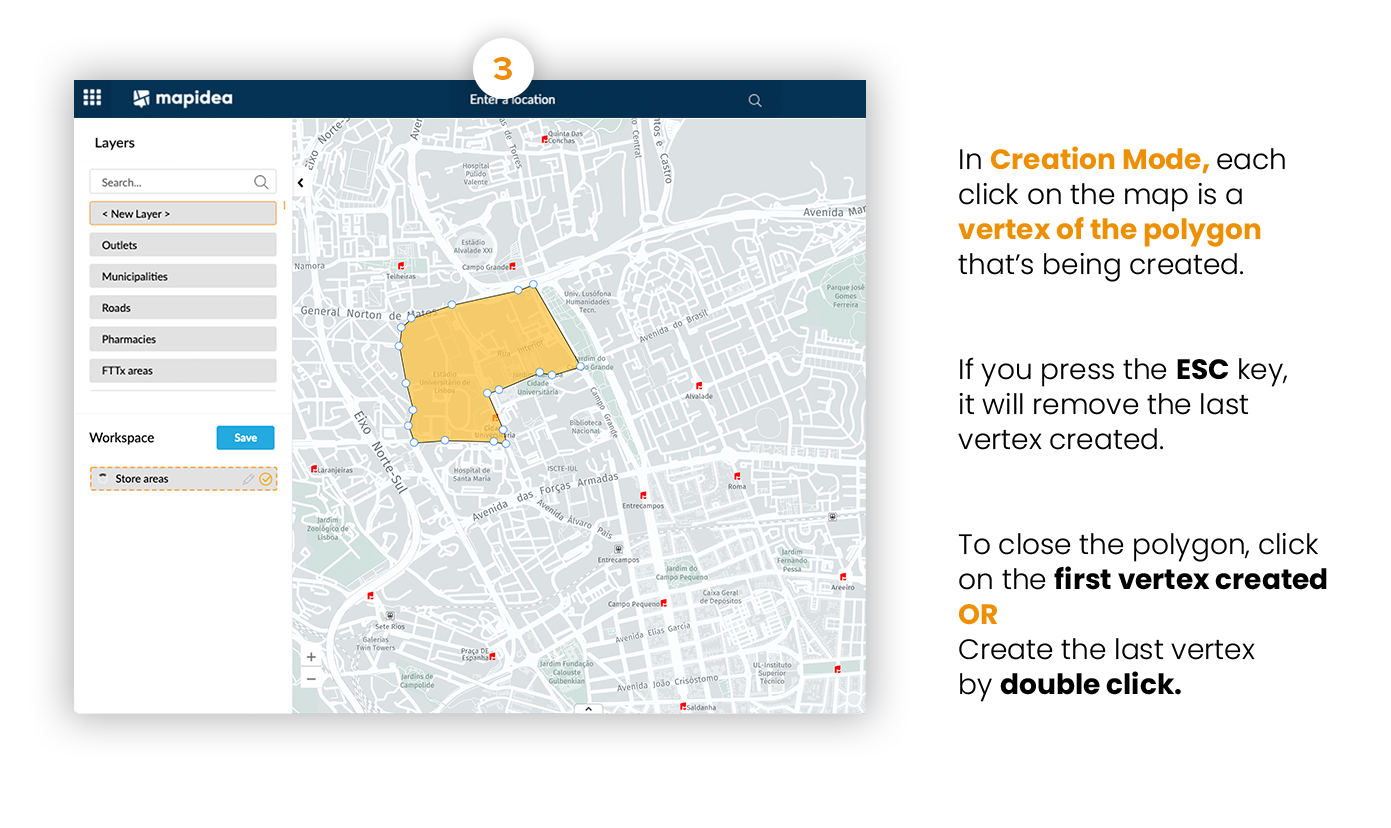
8.3 Areas
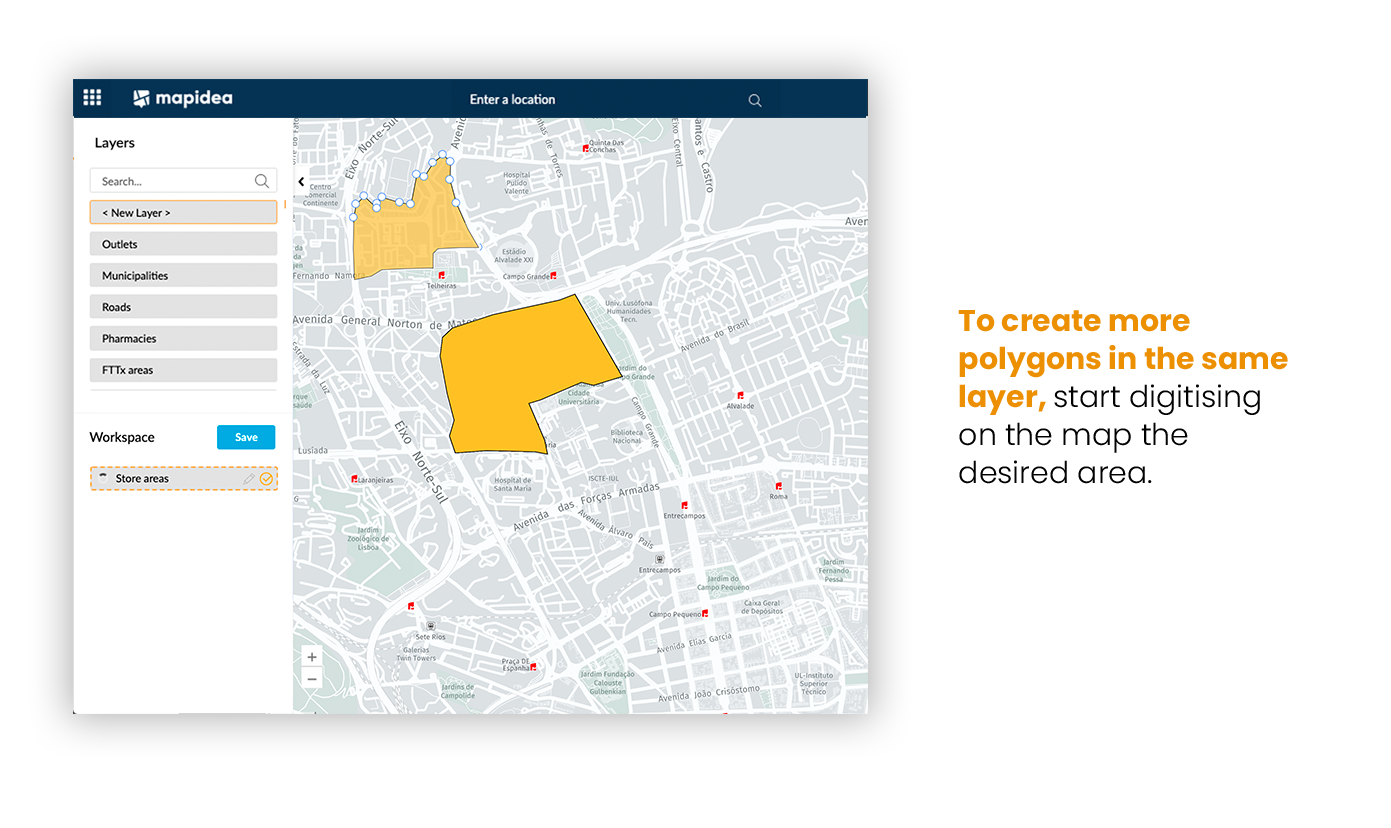
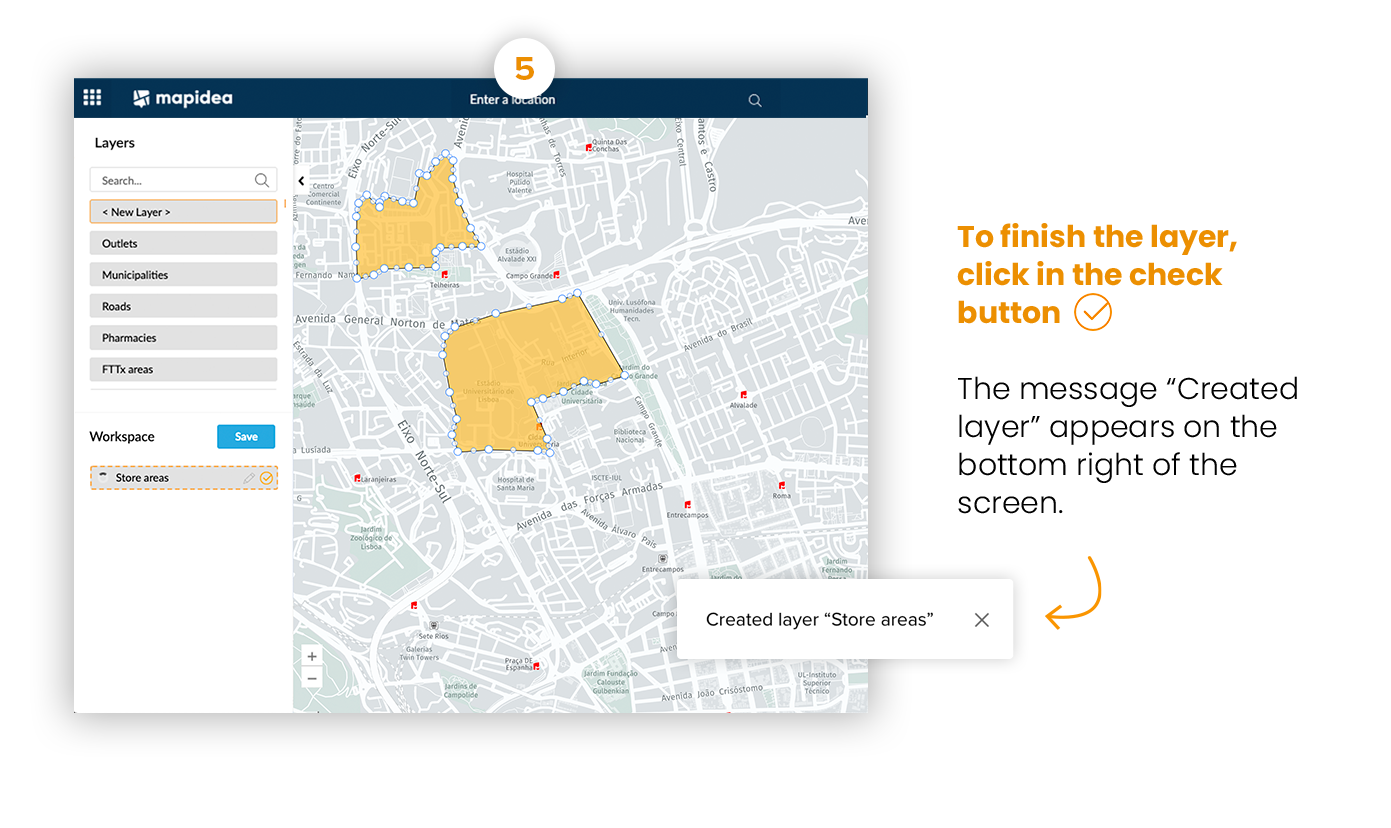
The created layer appears in the Analysis list in creation mode.
To create polygons, start digitising on the map the desired area.
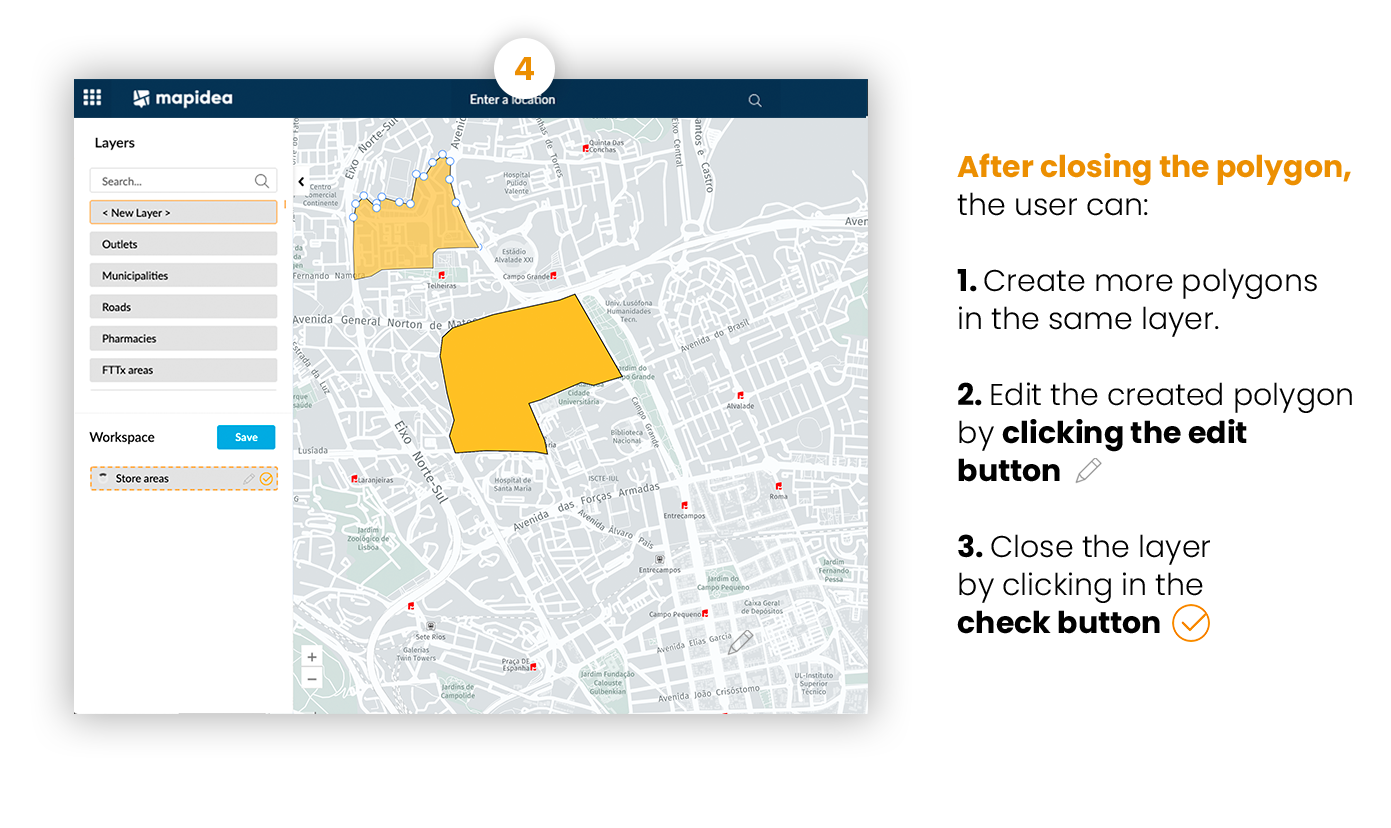
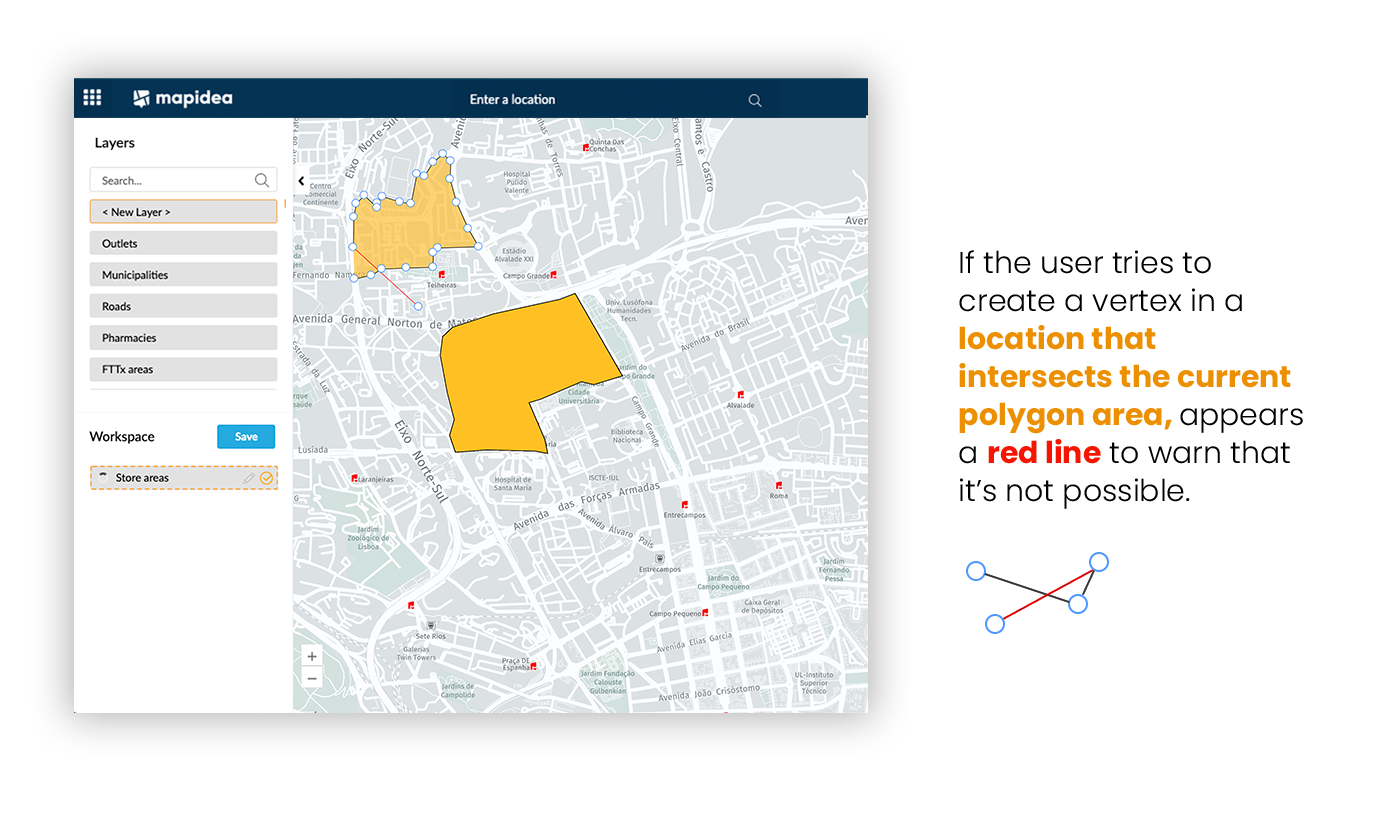
In Editing mode the user can:
1. Remove vertices with right click on top of a vertex; to remove the entire polygon, right click in all the vertices from that polygon;
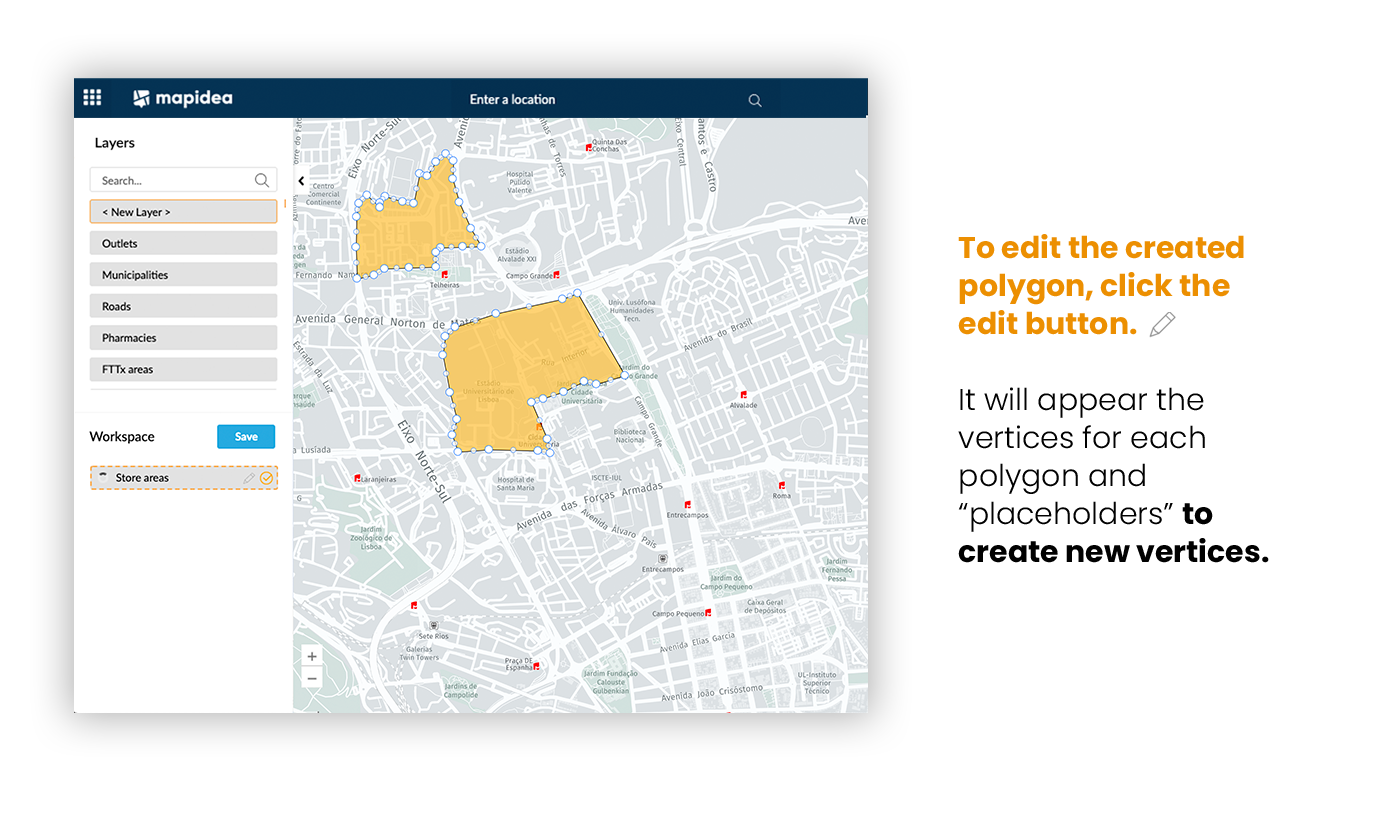
2. Move vertices by dragging & drop a vertice to the desired location;
3. Create new vertices by clicking in the “placeholders”; then drag & drop to desired location. Everytime a vertex is created, a new “placeholder” is created in between.
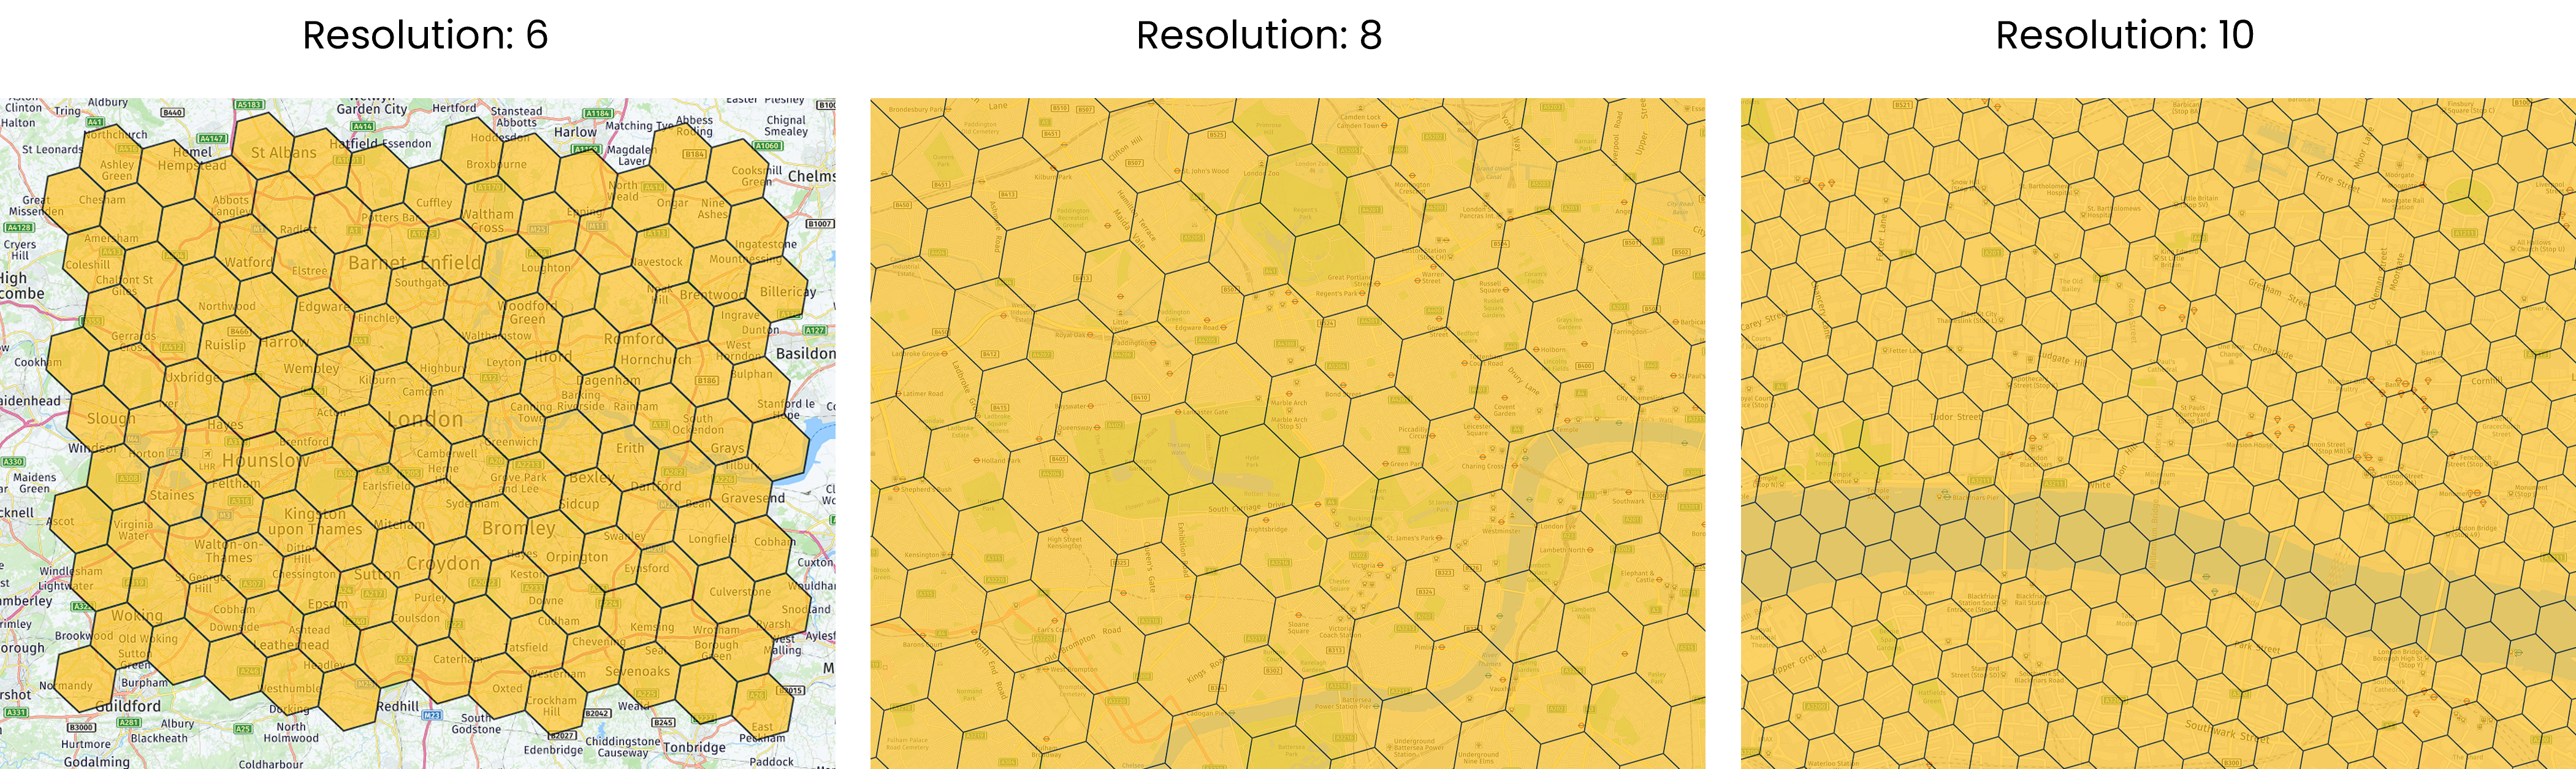
8.4 H3 Grid
H3 Grid is a geospatial indexing system that divides the world into hexagonal cells (with different resolutions). H3 was developed to address the challenges of Uber's data science needs.
To create the H3 Grid, you need to draw the area you want the grid to cover.

The size of the hexagons is defined by changing the zoom - before the layer is saved.
Zoom in to have smaller hexagons (higher resolution) or zoom out to create larger hexagons (smaller resolution).
8.5 Styles
If you press the icon of the layer in the workspace, under "Settings" you can visually customize all types of data created and added to Mapidea: polygons,lines and points.
8.5.1 Points
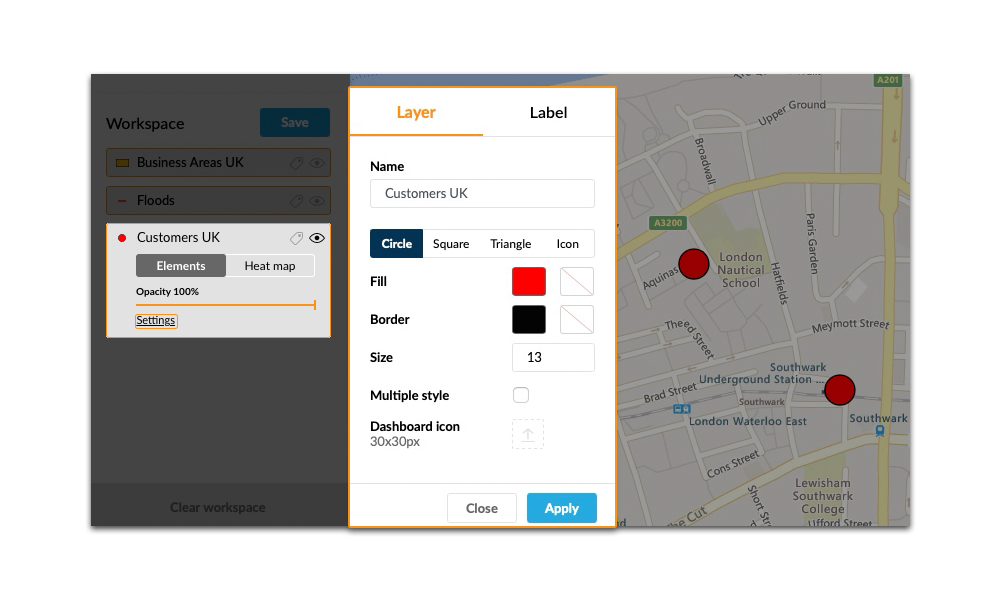
With points, you can change:
- Symbol type;
- Symbol size;
- Border and fill color;
- Level of opacity;
- Load a custom icon to be used on the map and in the Dashboard;
- Give multiple styles to a layer
8.5.2 Lines
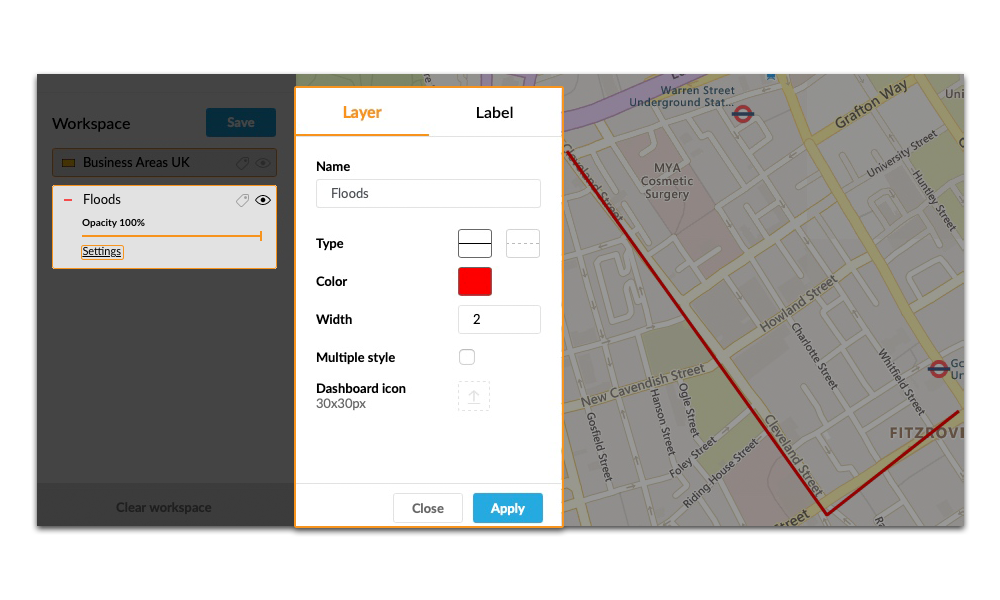
With lines, you can change:
- Line style;
- Line width;
- Line color;
- Load a custom icon to be used in the Dashboard;
- Give multiple styles to a layer
8.5.3 Polygons
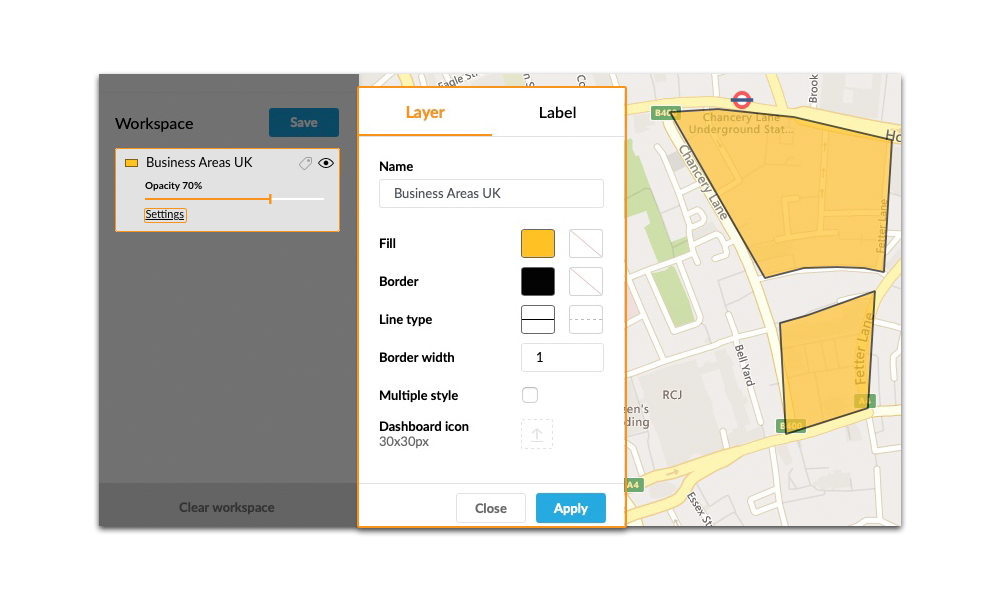
With polygons, you can change:
- Border style;
- Border width;
- Border and fill color;
- Level of opacity;
- Load a custom icon to be used in the Dashboard
8.5.4 Multiple Style Layer
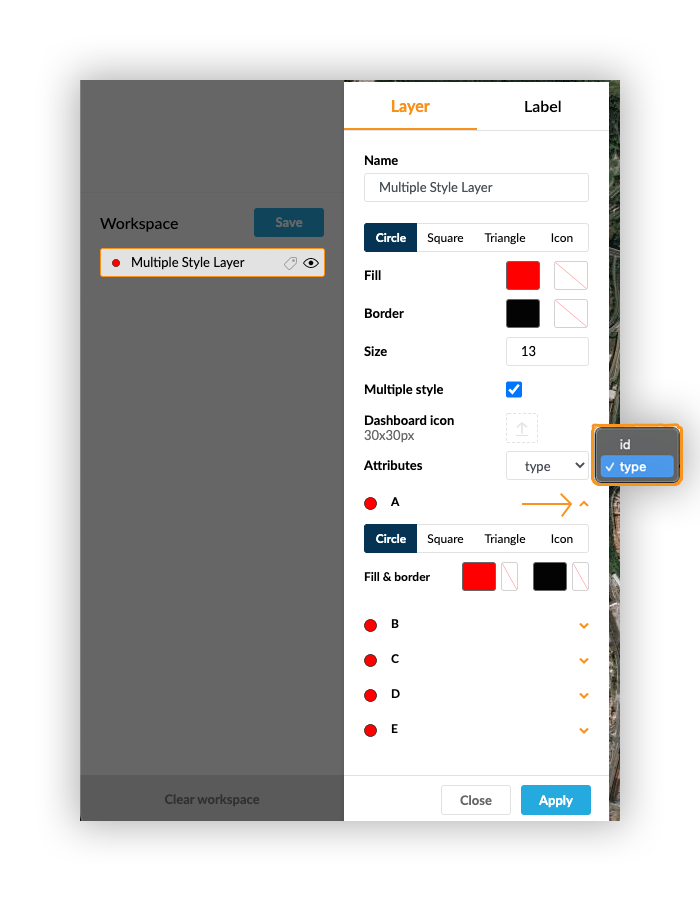
With this feature, it’s possible to have multiple symbols on the same layer.
After activate the multiple style option, an attribute combo appears, to select which attribute should be used. For each different value, there are individual options to configure an internal symbol or upload an external one.
For example, you can have all fast food locations in one layer, using one different symbol for each brand.