Contents
1. Basics
![]() Updated
by Mapidea Team
Updated
by Mapidea Team
1. Basics
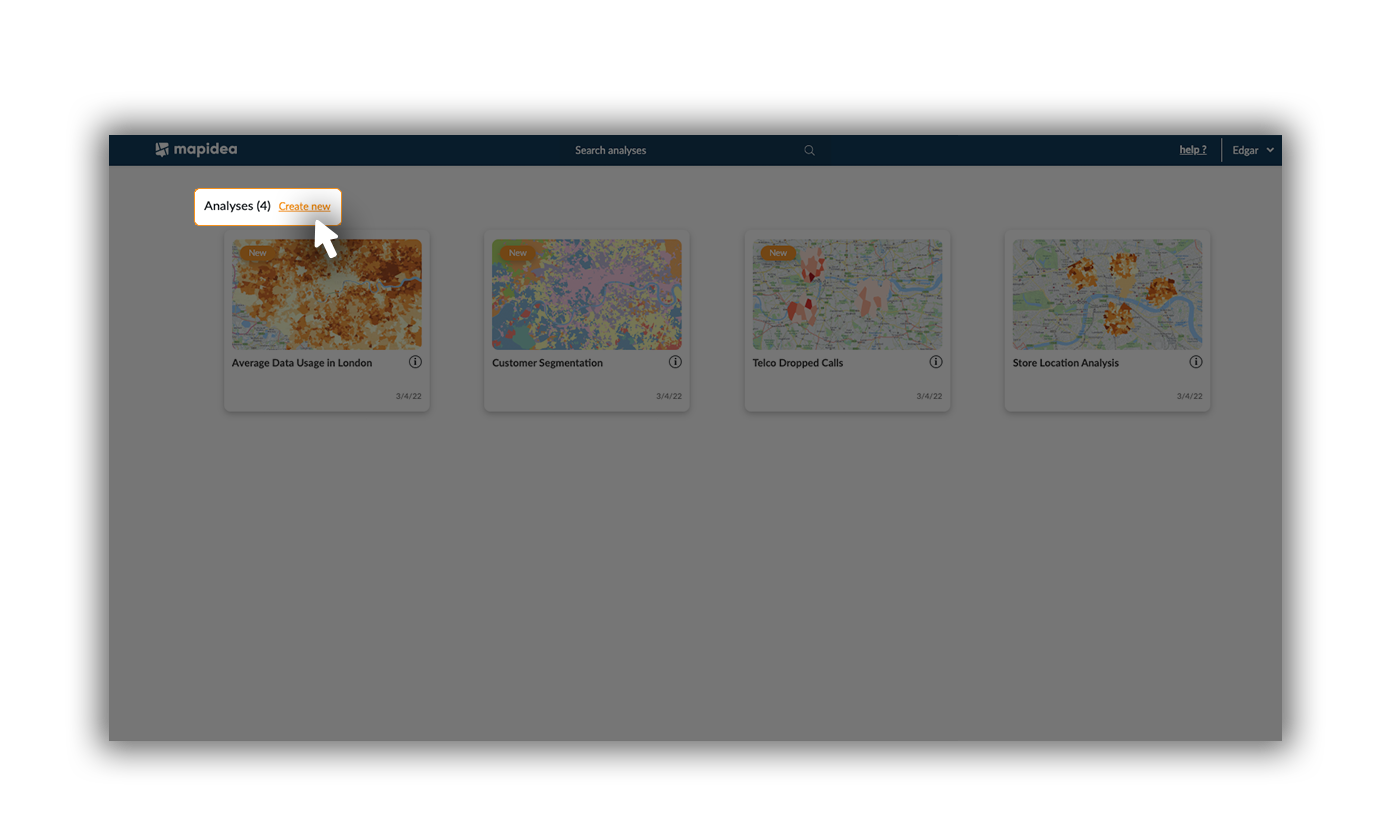
After a user logs in Mapidea, it has access to the Analysis Gallery. A single click in one of the analysis thumbnail will load it. To create a new analysis, just press Create New and the layers list will be visible, along with the map area.
After pressing "create new", the user has access to the map view and the main interface window.
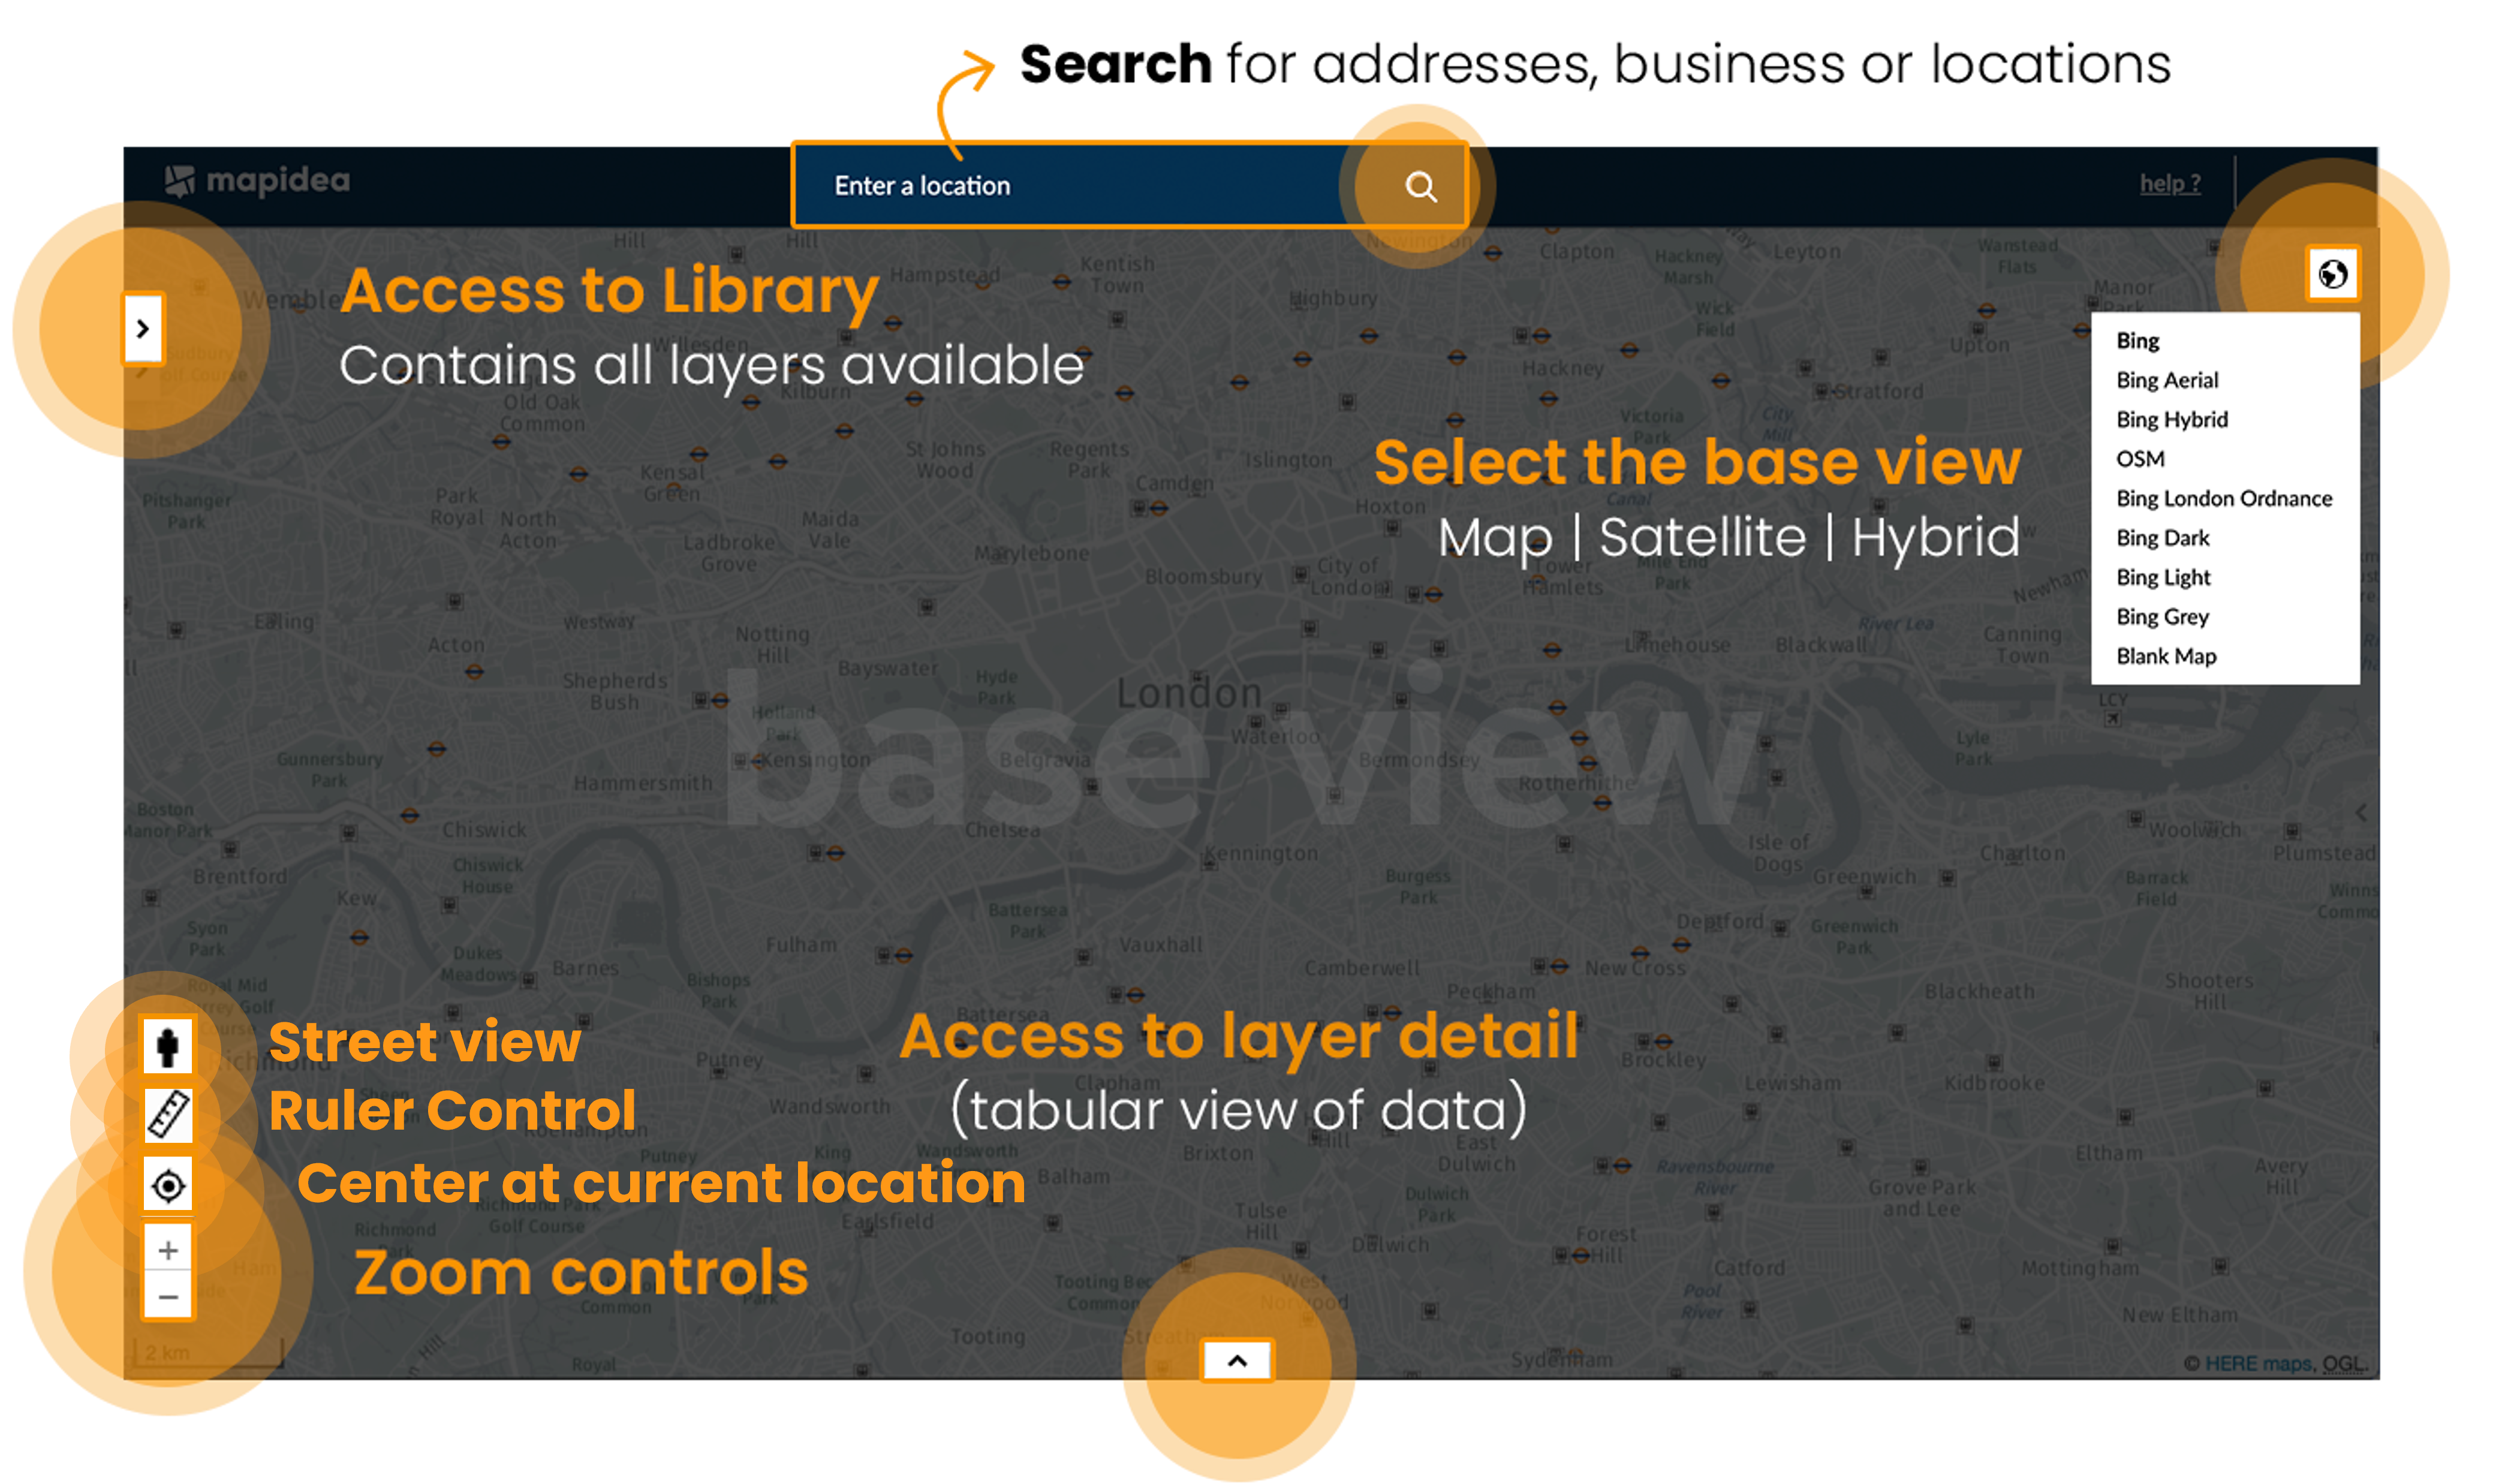
Street view: Drag the icon and drop it somewhere in the map to open a new tab with the streetview.
Ruler Control: Click on the map and will appear a ruler. To stop using it, click again in the Ruler Control icon or "ESC" on your keyboard.
Center to current location: Gives you a close-up to your location on the map.
Layers are available in the Library area, on the left side pane. If the user have loaded an existing analysis, a tab contains the name and its description.
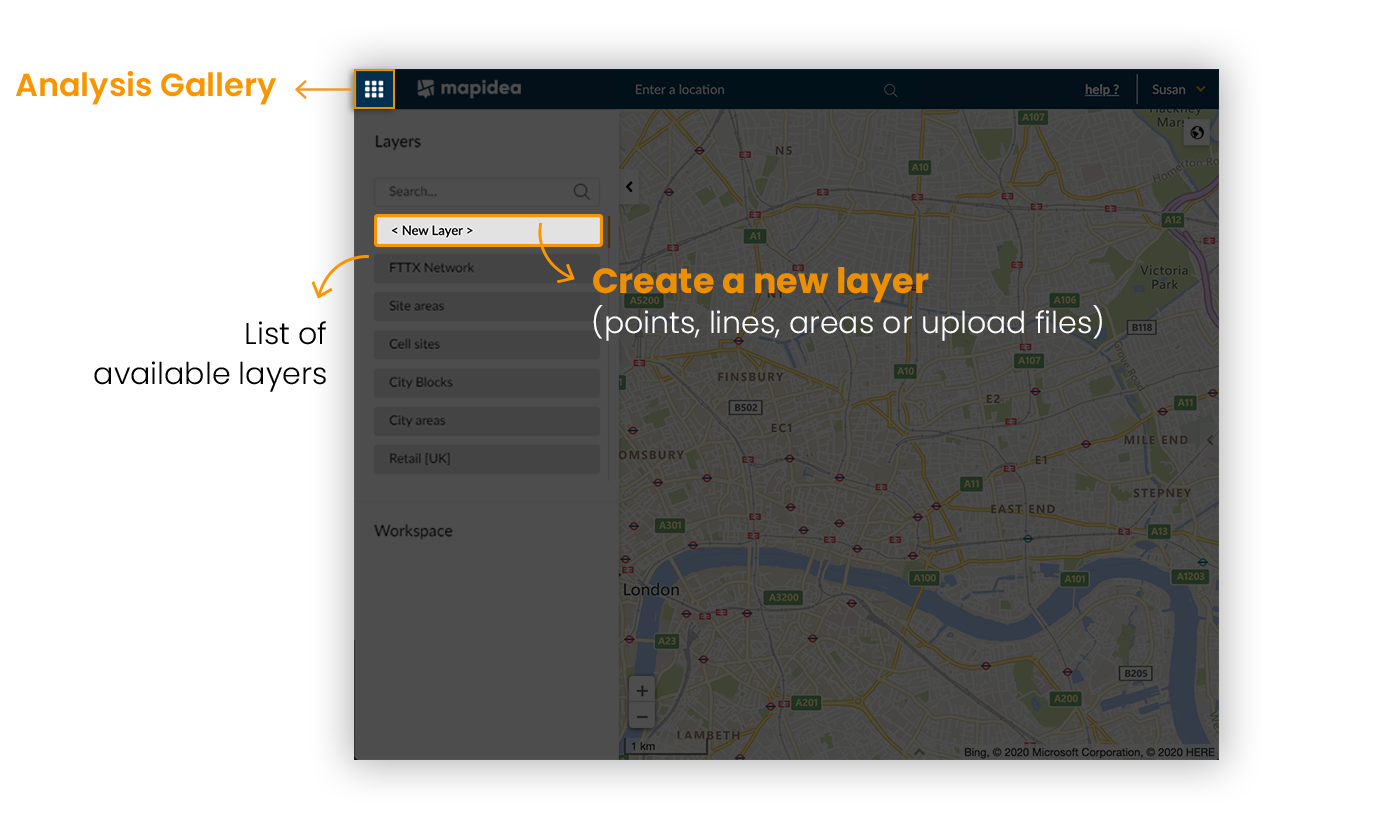
Almost every action in Mapidea is done with drag & drop. To load a layer or analysis, drag & drop it to the map area to visualize its content.
2. Console
To access the main functionalities console, double click in a layer in the workspace area.
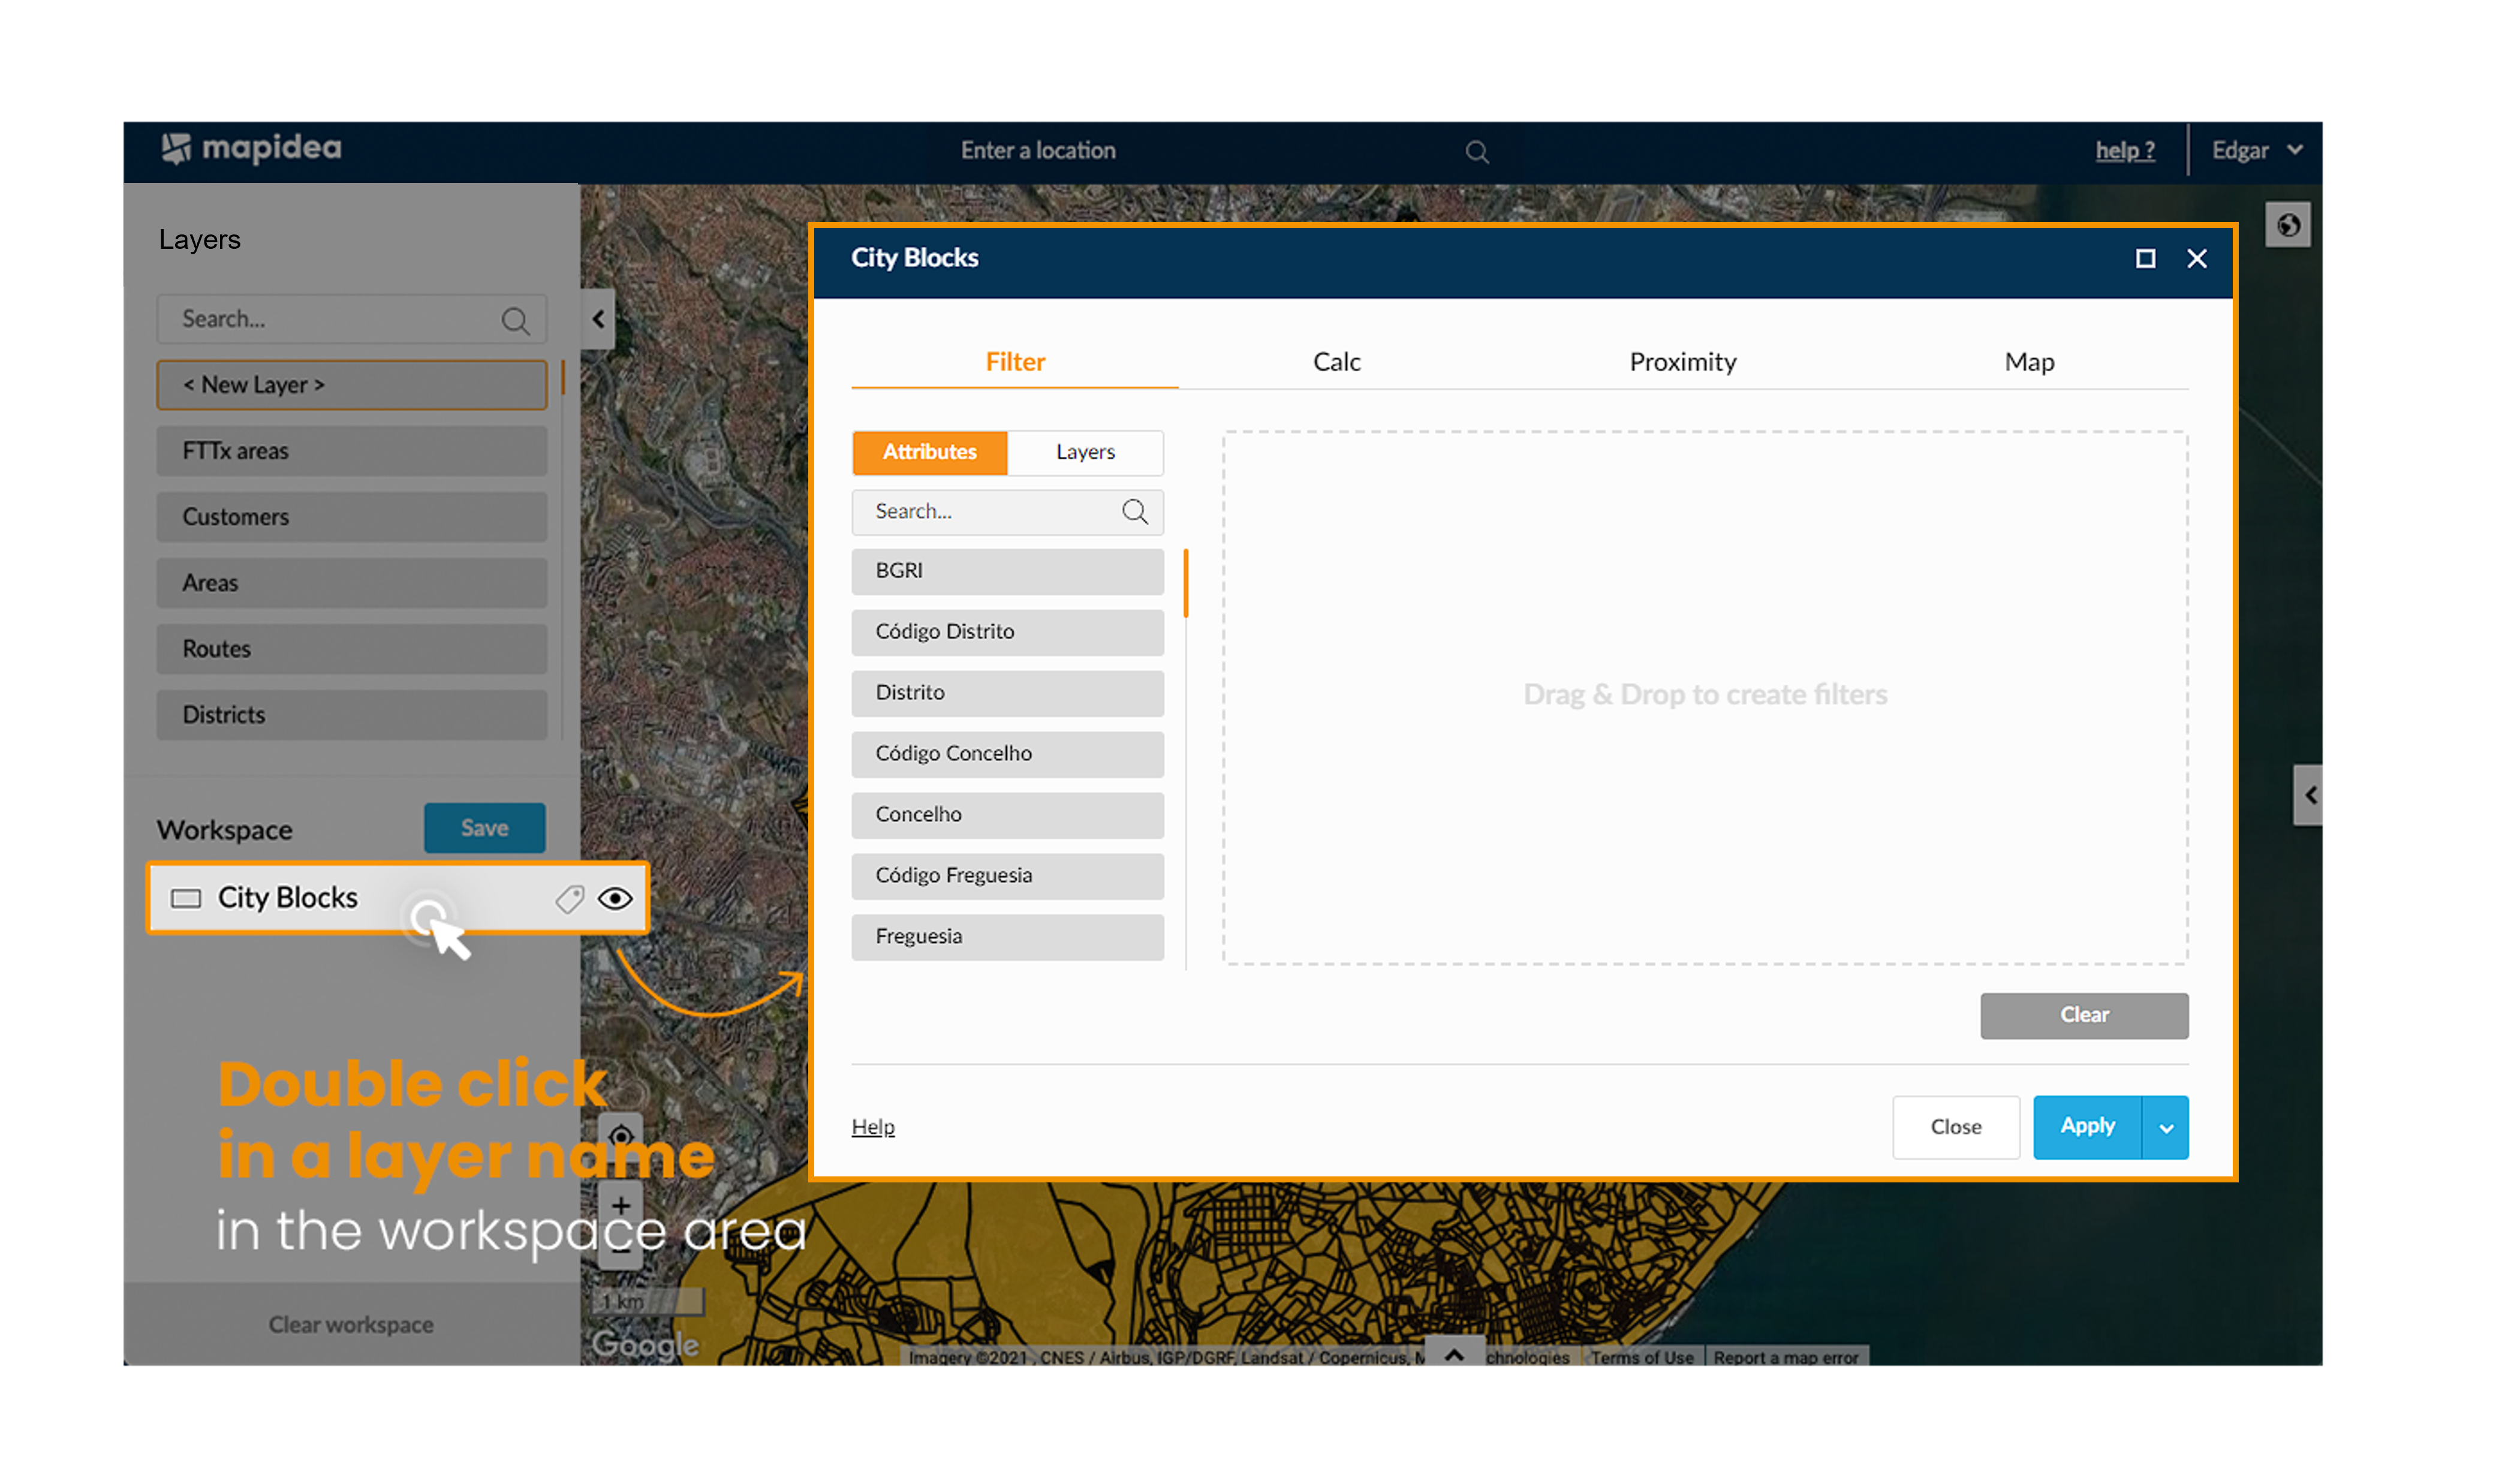
By clicking on the maximize button (top right corner), the console switches to full screen (Very useful to read some attributes that have long names, like “Average measurements per city block” or “Residents with higher propensity to have two or more cars”).
3. Table View
Clicking on the bottom arrow accesses Table View. Here you can check the attributes, switch their order, change the aggregation method and add new ones.
With table view, you can switch to another layer's attribute by clicking on the name of the layer and you can click on the summary line to change how it aggregates numeric columns, meaning you can check the sum, average, minimum, maximum or none for each column.
When you click on an element on the map, that element also becomes visible in the table view (it is highlighted). On the other hand, if you click on an element in the table, it is also highlighted and zooms in on the element on the map.
4. Workspace
In the Workspace area it’s possible to control the layers on display.
It’s possible to turn the layer visible or invisible and enable or disable the layer label.
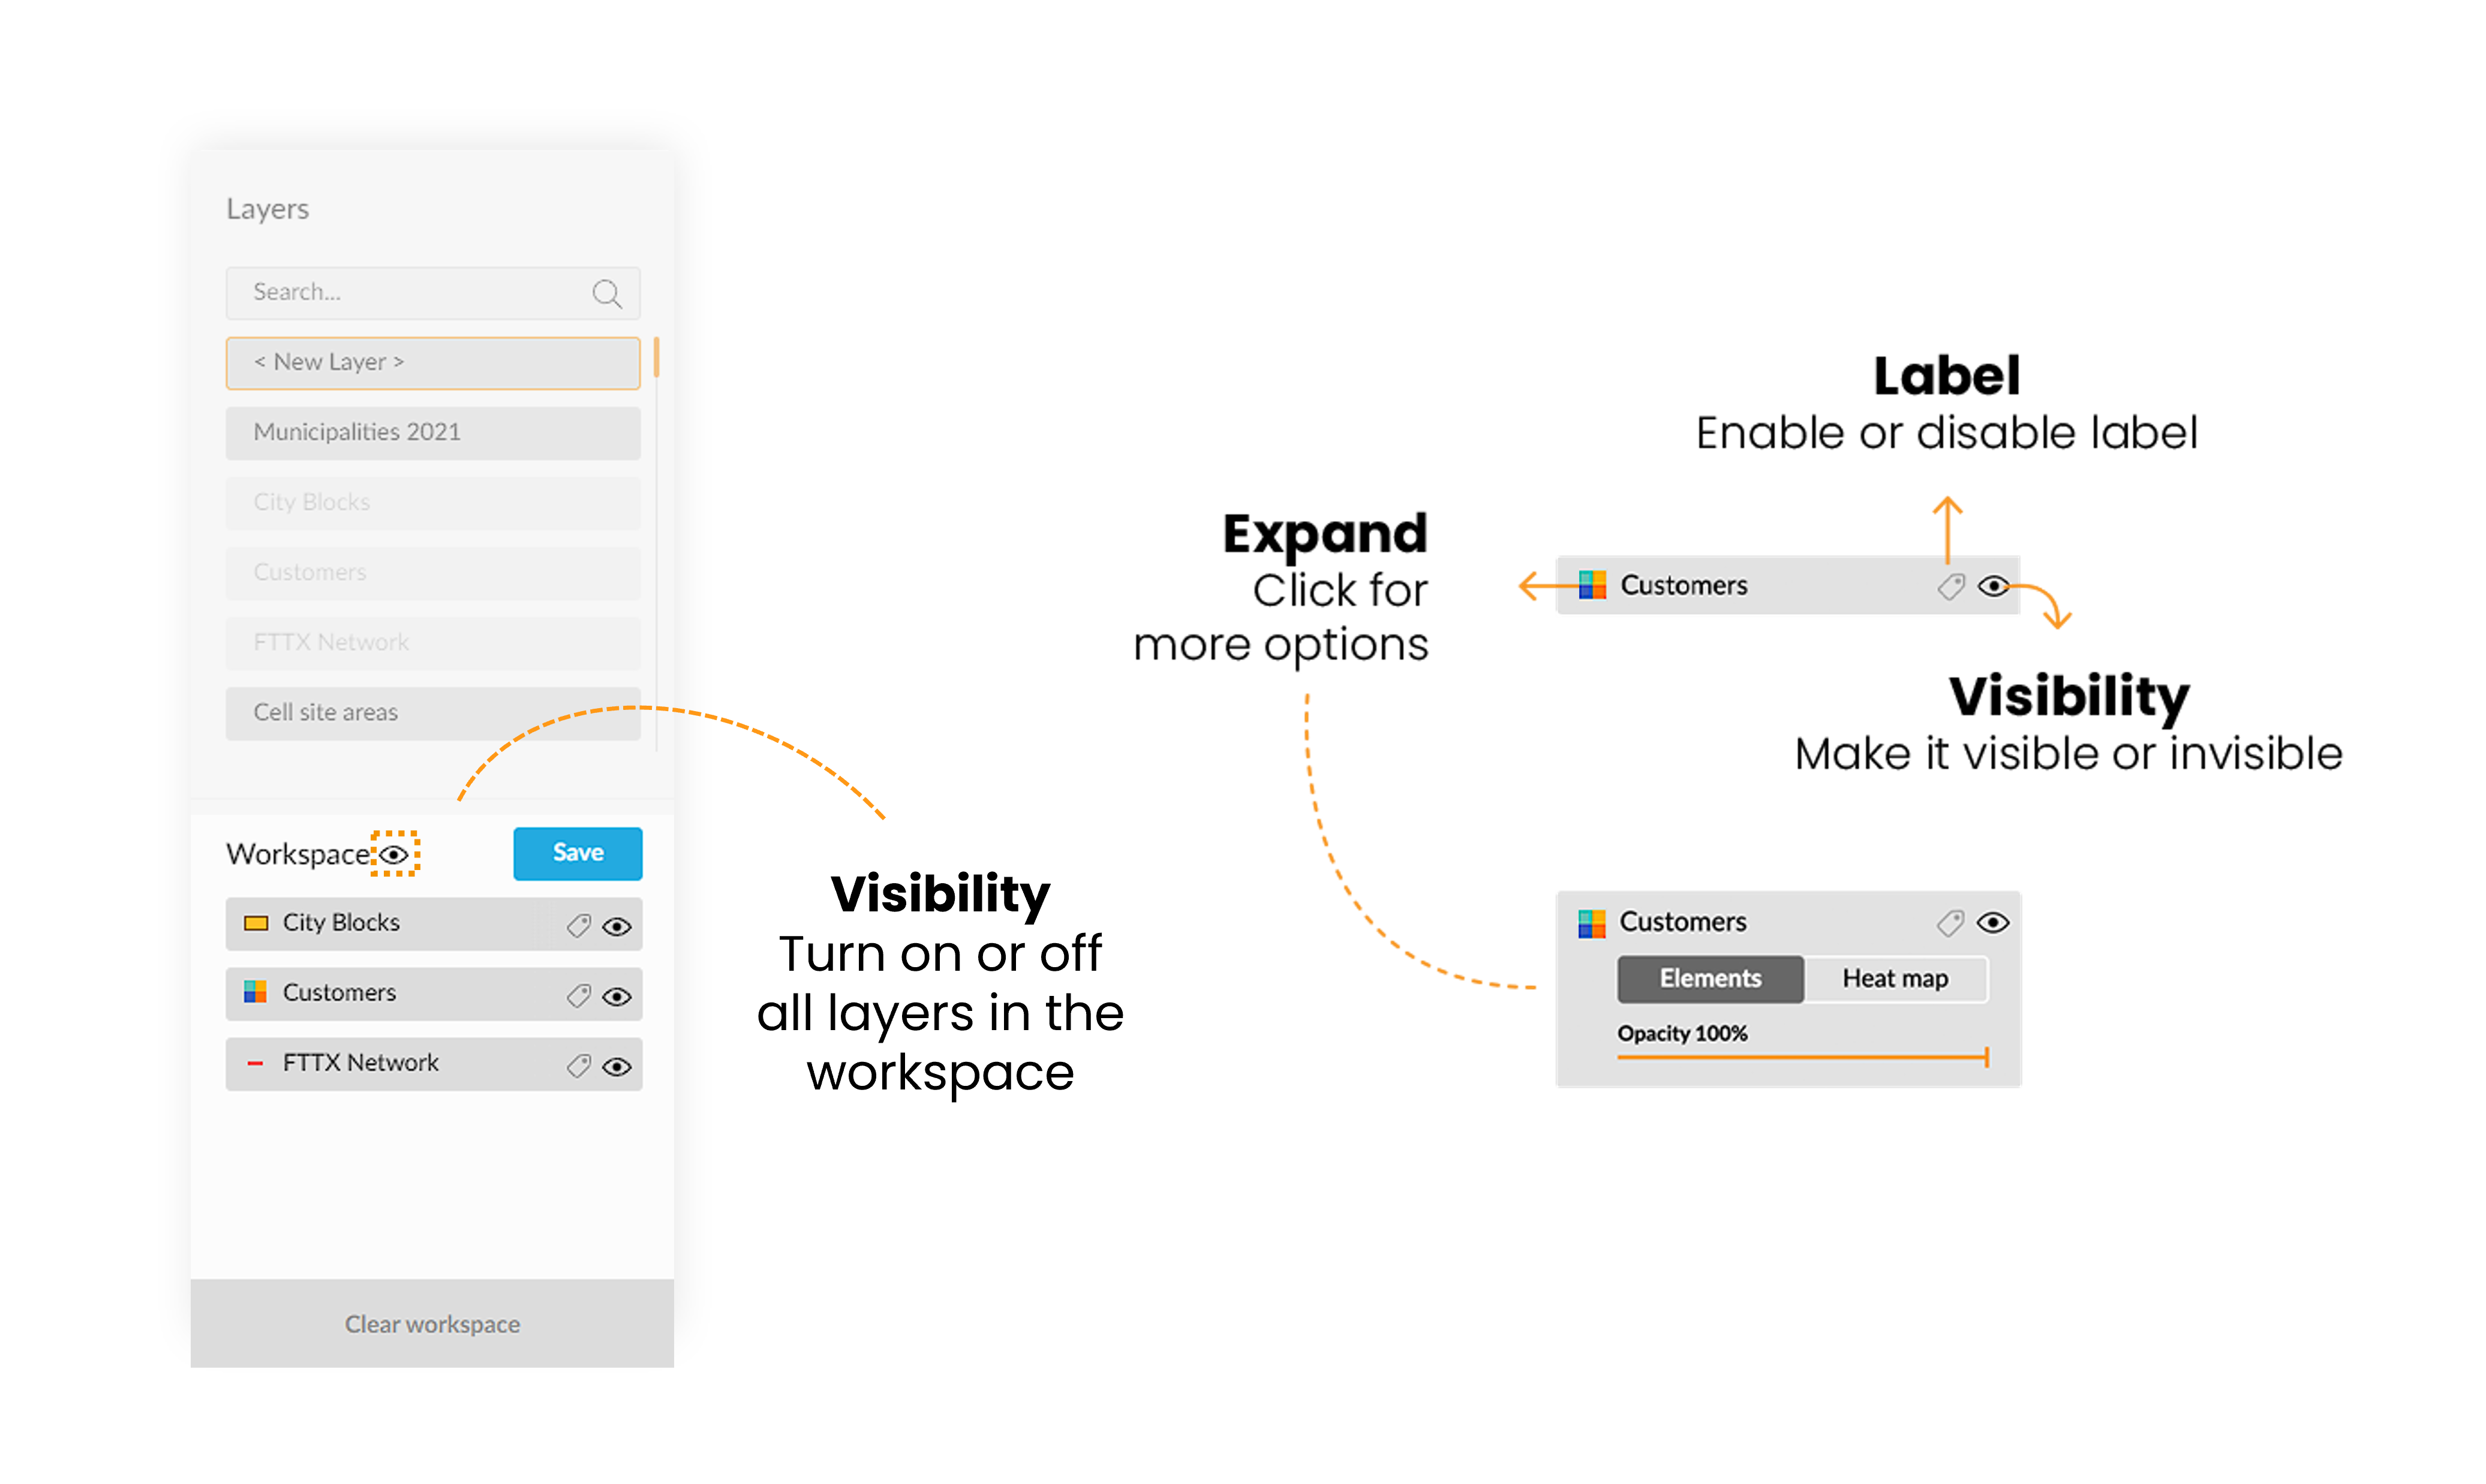
By clicking on the layer icon, it’s possible to define the layer opacity and, if dealing with points, it’s possible to do heatmaps.
To remove a single layer from the map, just drag and drop into the remove layer area:
4.1 Settings
By clicking on the layer icon, it’s possible to configure the layer in the settings button.
We can choose the label you want to be shown.
We can also define a layer as being selectable or not.
And we can define the style of the element in the application (permanently or just for that analysis).
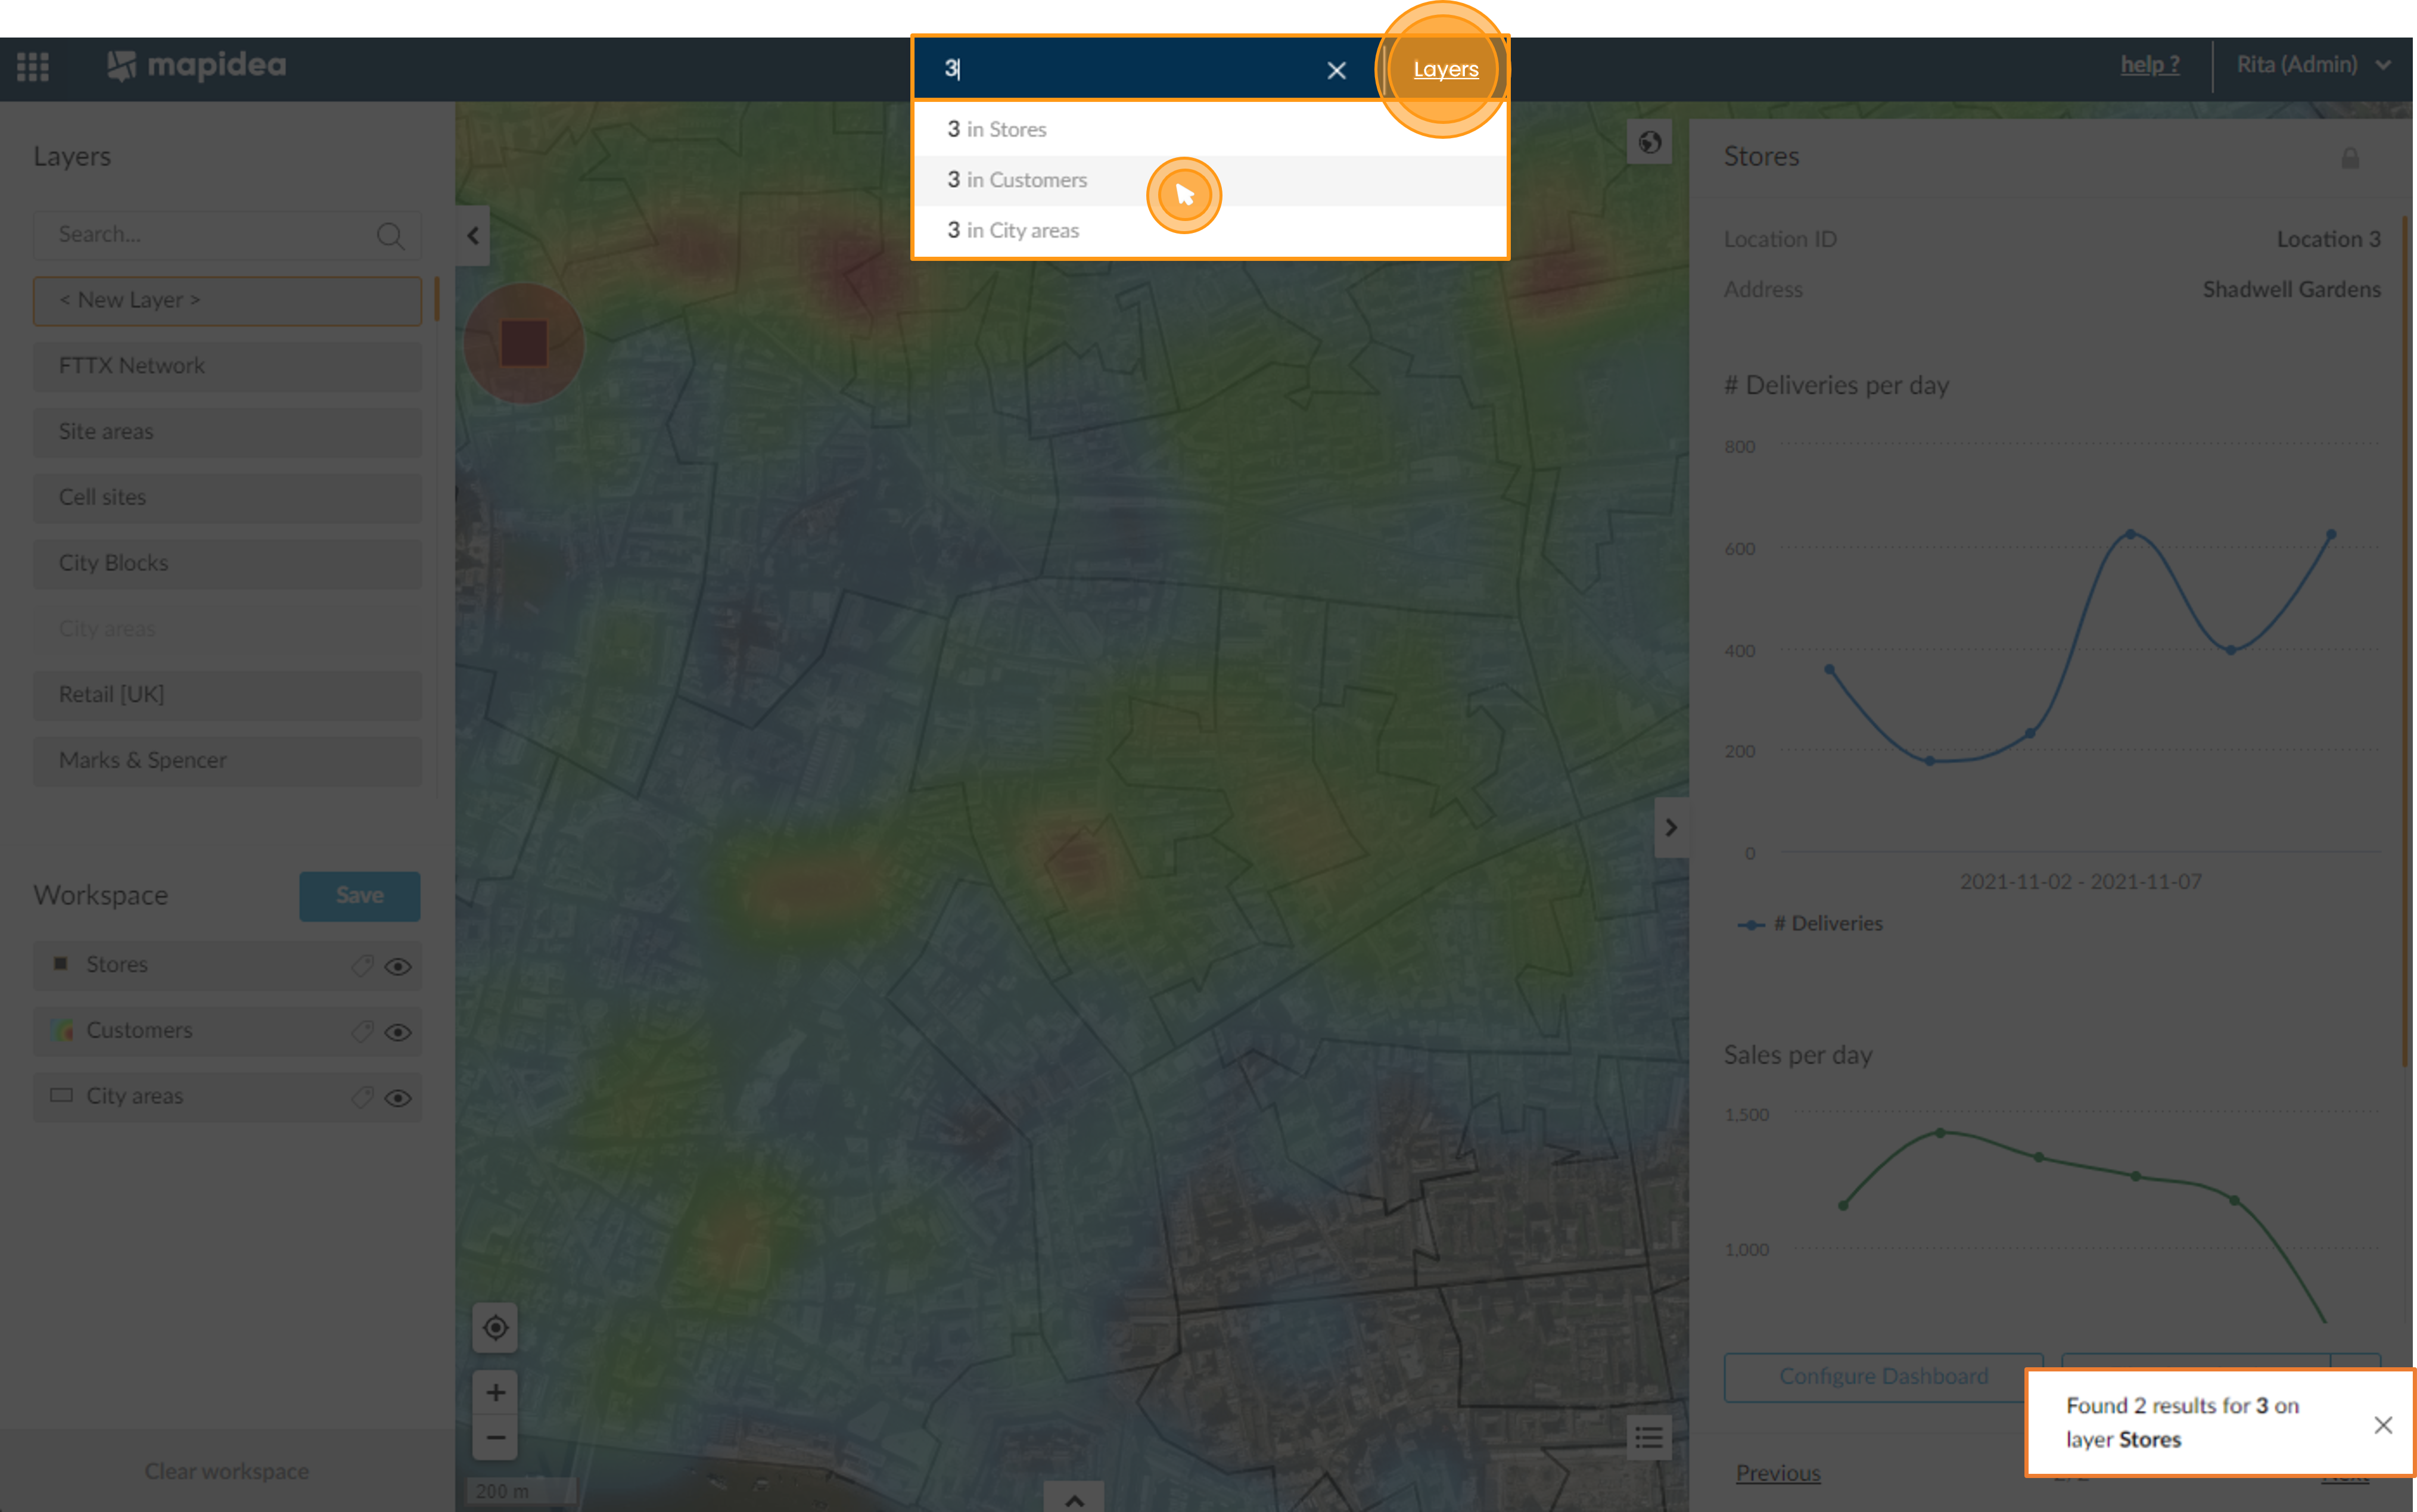
5. Search
Here you can search for an address or for coordinates when you have the "Location" option active.
To search within a layer click, in the top bar, on "Location" to switch to "Layer". Search for the keyword you want to find within the layer and click on the layer you want to search on.