Contents
7. Maps
![]() Updated
by Mapidea Team
Updated
by Mapidea Team
Map tab allows to create visualizations from attributes, exposing data patterns over a thematic map.

It's possible to change some characteristics of the map (number of classes, color scheme, classes ranges and individual class color):
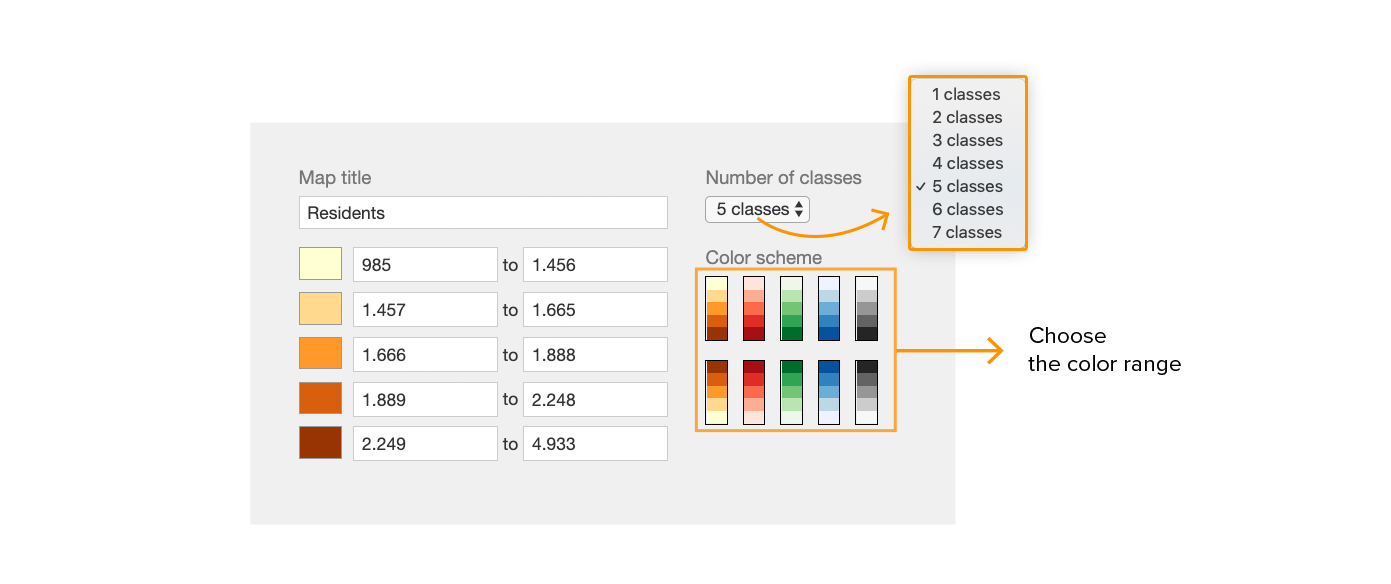
It's also possible to change the color of each class from a palette of pre-defined colors or a custom Hex / RGB / HSL value by clicking on the More colors button.
Click on the legend class to make it visible or invisible on the map.
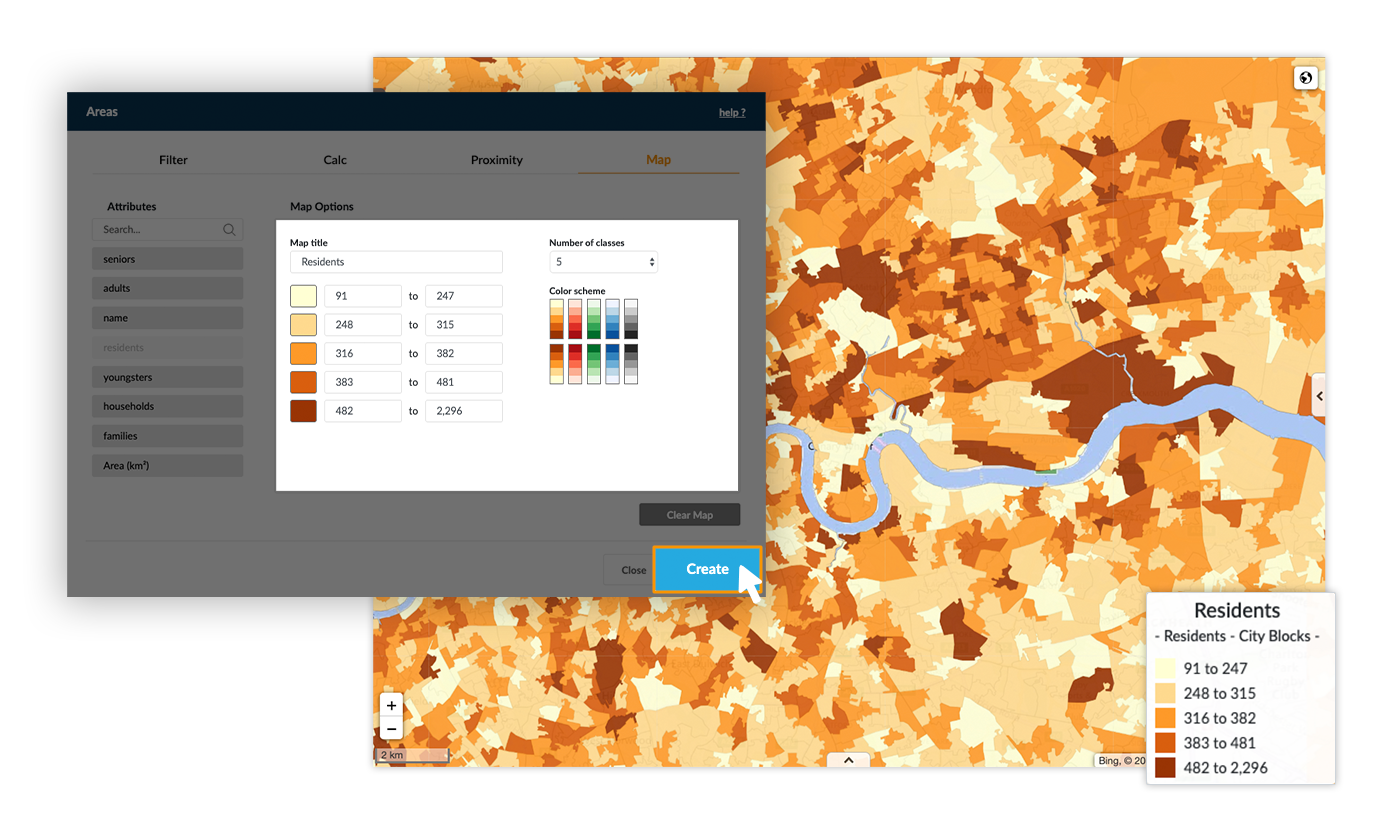
7.1 Range Map
If you drag & drop a numeric attribute, Mapidea will create a range map. By default, creates a 5 class legend and uses a natural break distribution to divide the elements per class.
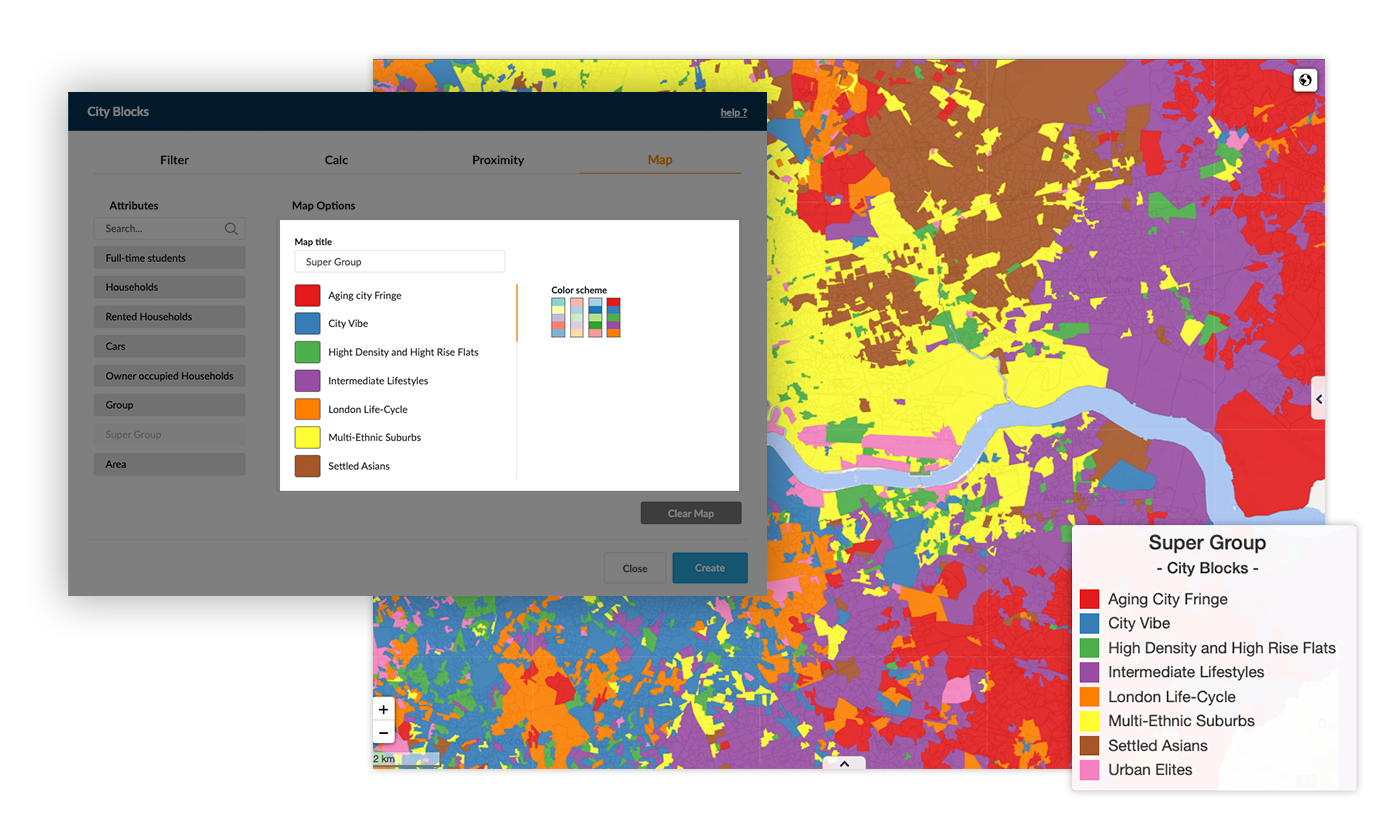
7.2 Individual Map
If you drag & drop a text attribute, Mapidea will create an individual map. For each individual value a unique color is assigned.
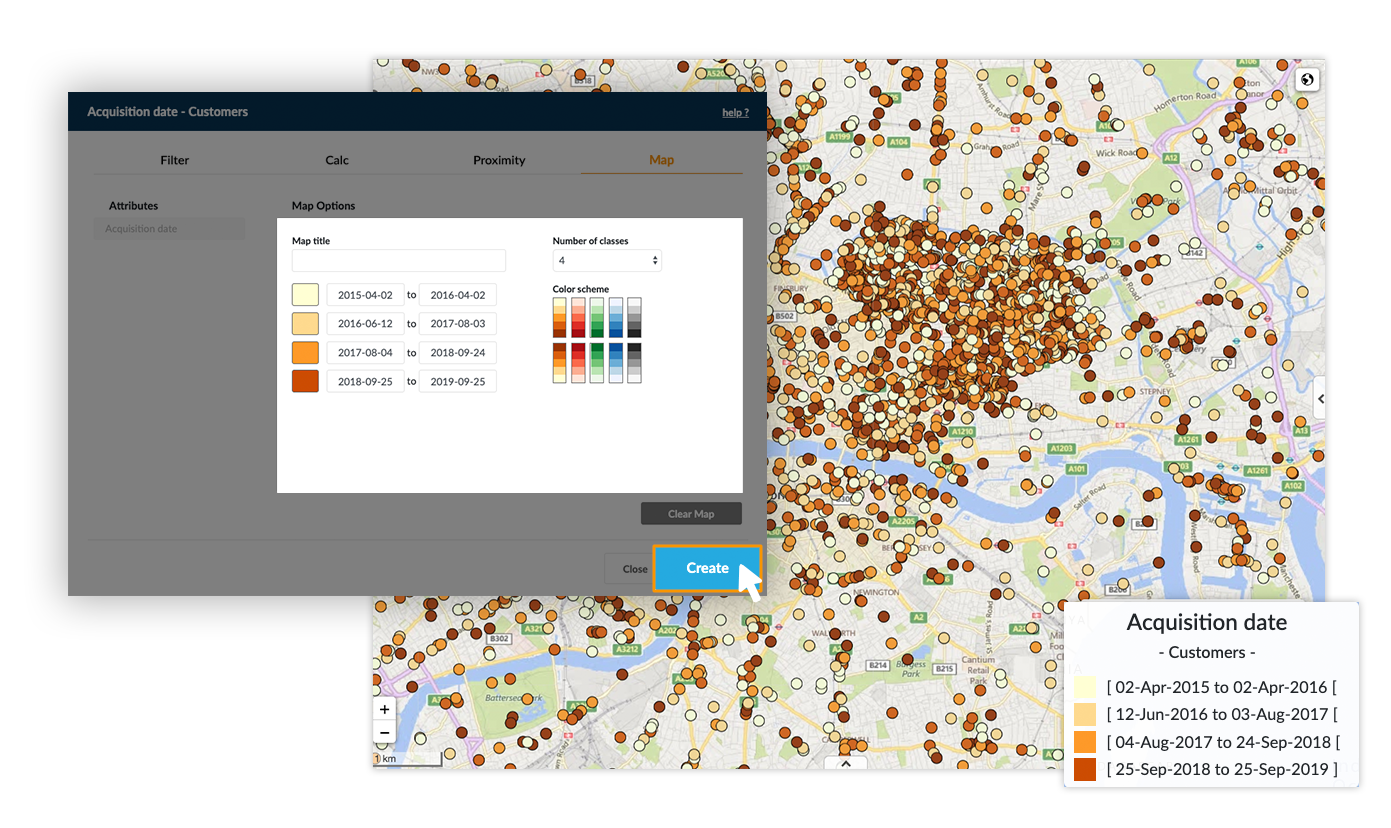
7.3 Date Map
If you drag & drop a date attribute, Mapidea will create a date map. By default creates a 5 class legend and divides the dates using a natural break to distribute the elements per class.
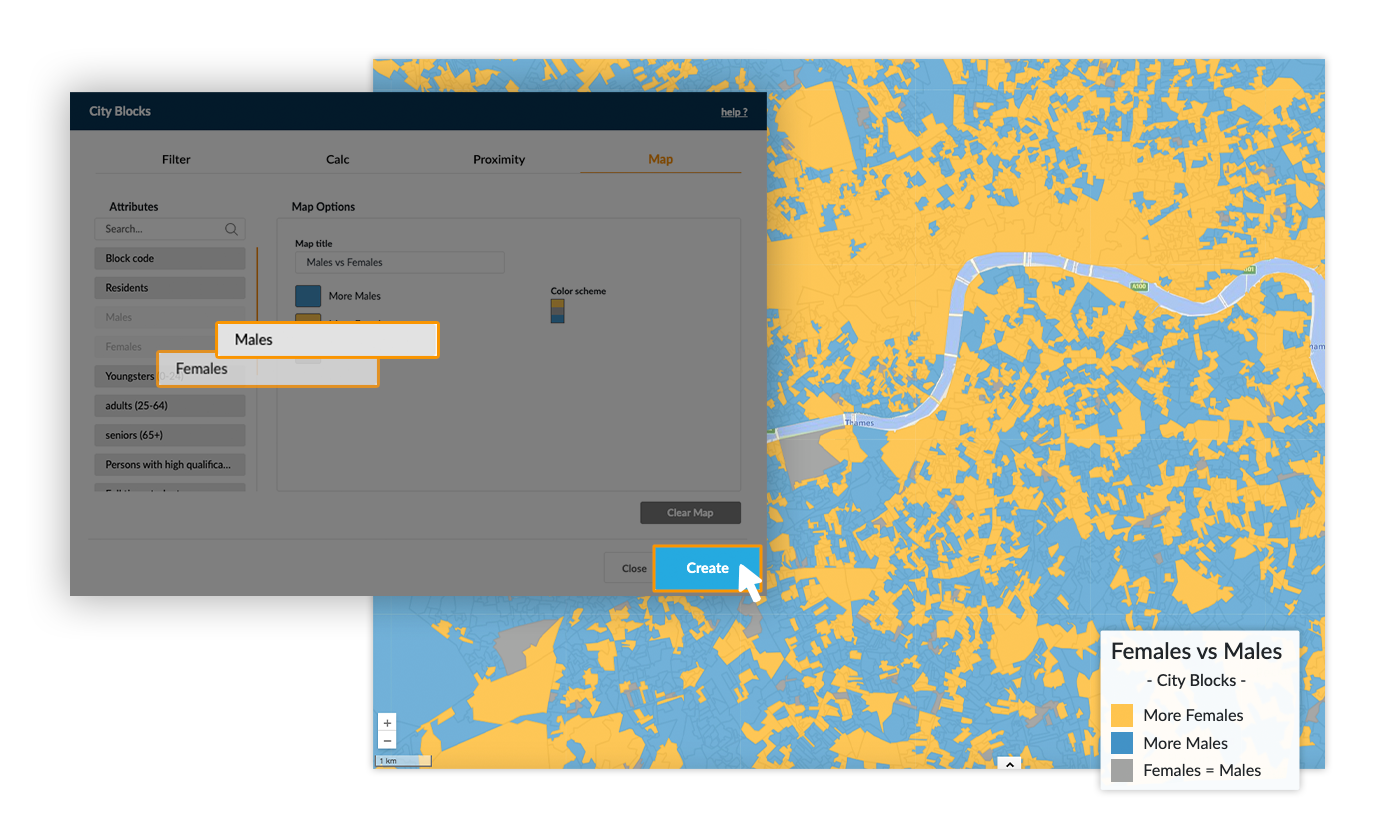
7.4 Comparison Map
To create a comparison map, drag & drop two numeric attributes. It divides the elements into 3 classes: where value from first used attribute is higher than the second, where the second is higher than the first and where the value is equal.
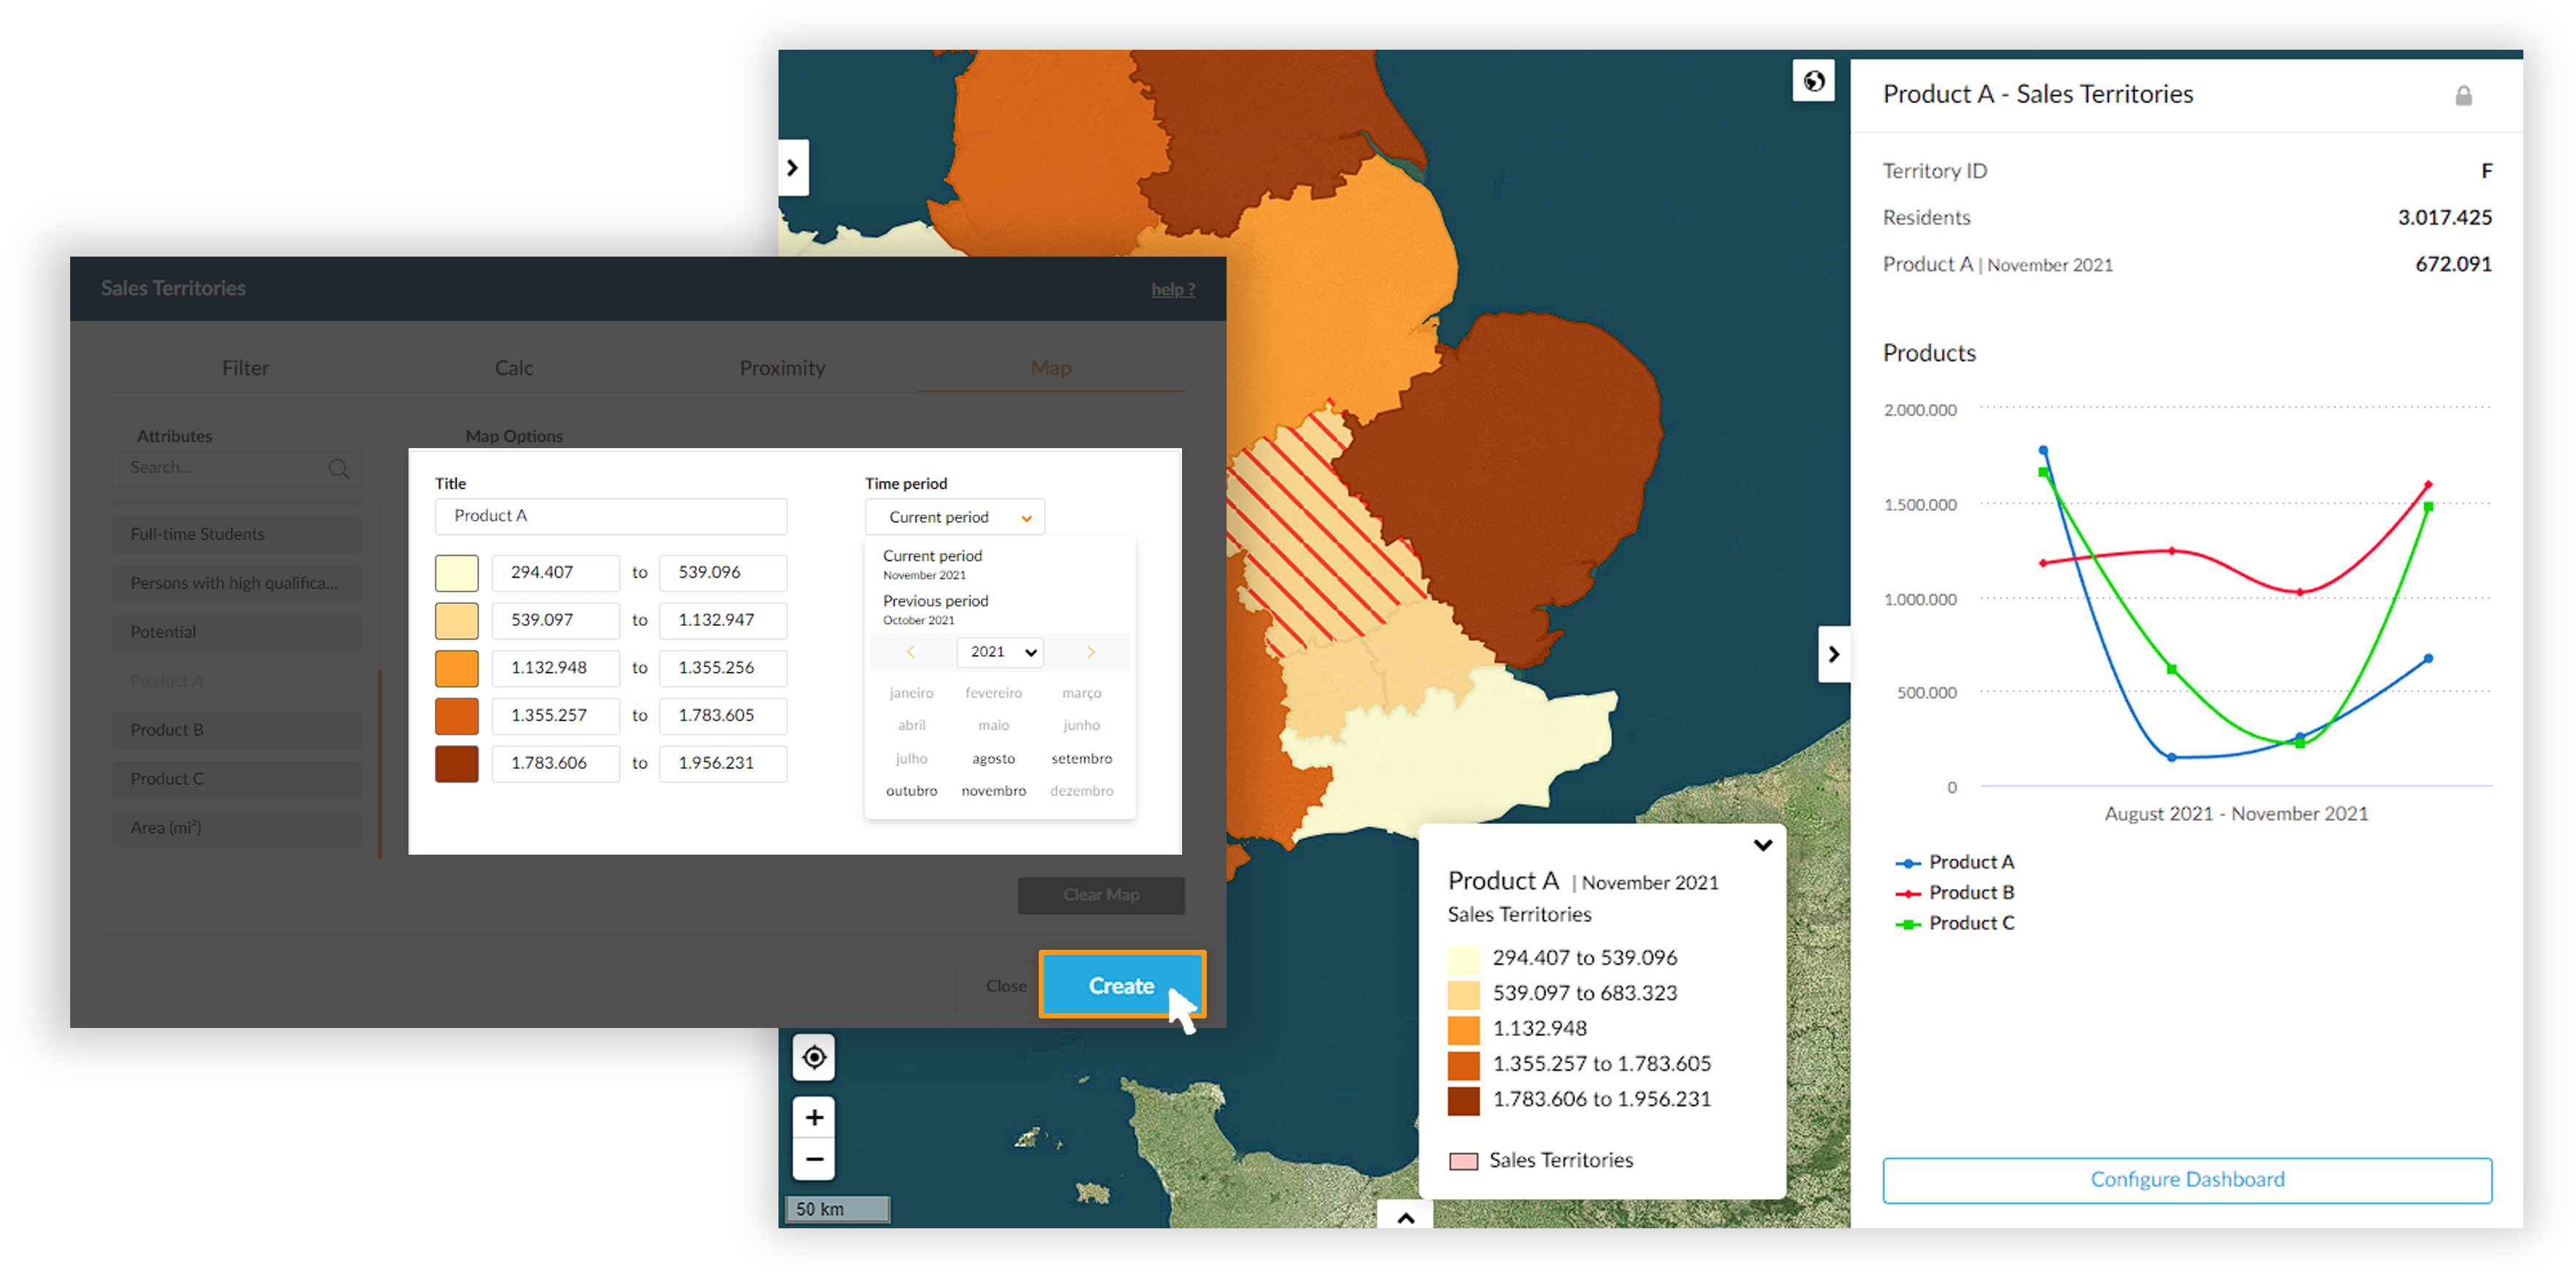
7.5 Temporal Map
To create a temporal map the layer must have temporal data. At the map tab, drag & drop an attribute and choose the time period to represent.
7.5.1 Temporal Video
After choosing the time period to view on the map, the option to play a video of the last 6 time periods of the layer will appear.
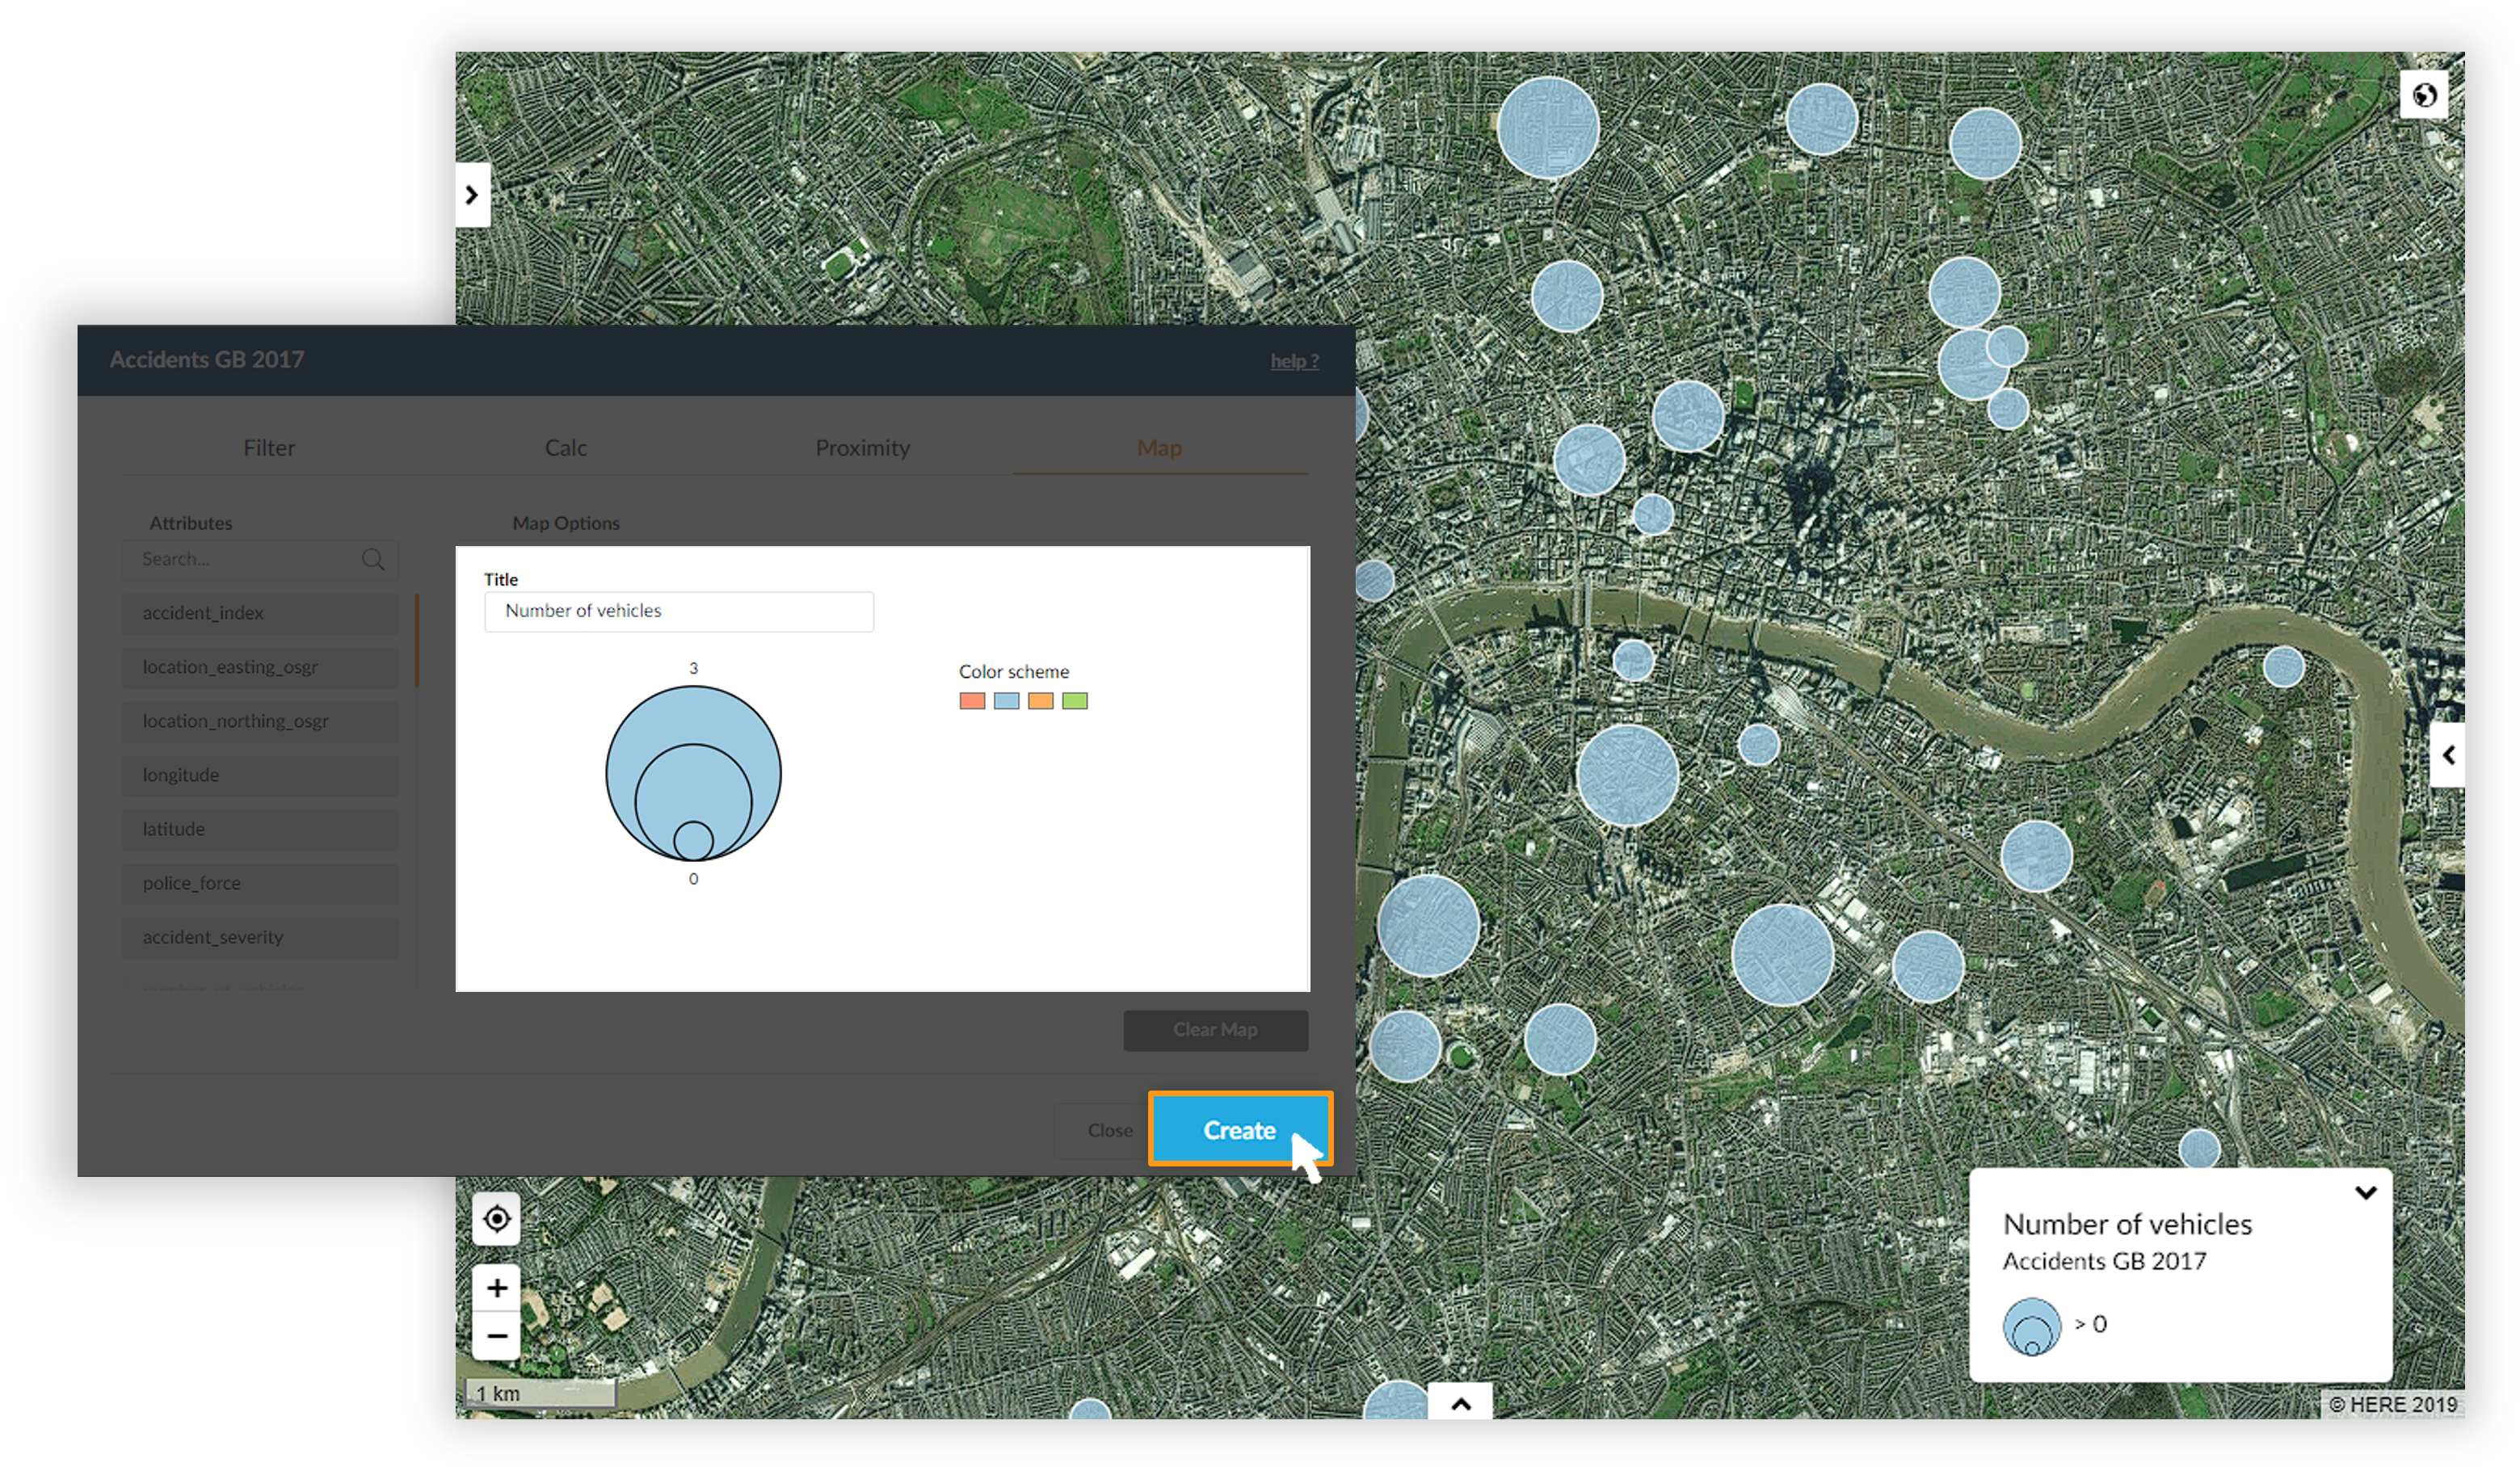
7.6 Proportional Symbol Map
In the map console, if you drag & drop a value attribute of a point layer, and that layer has less than 50 points, instead of a ranged map it will be created a proportional symbols map.
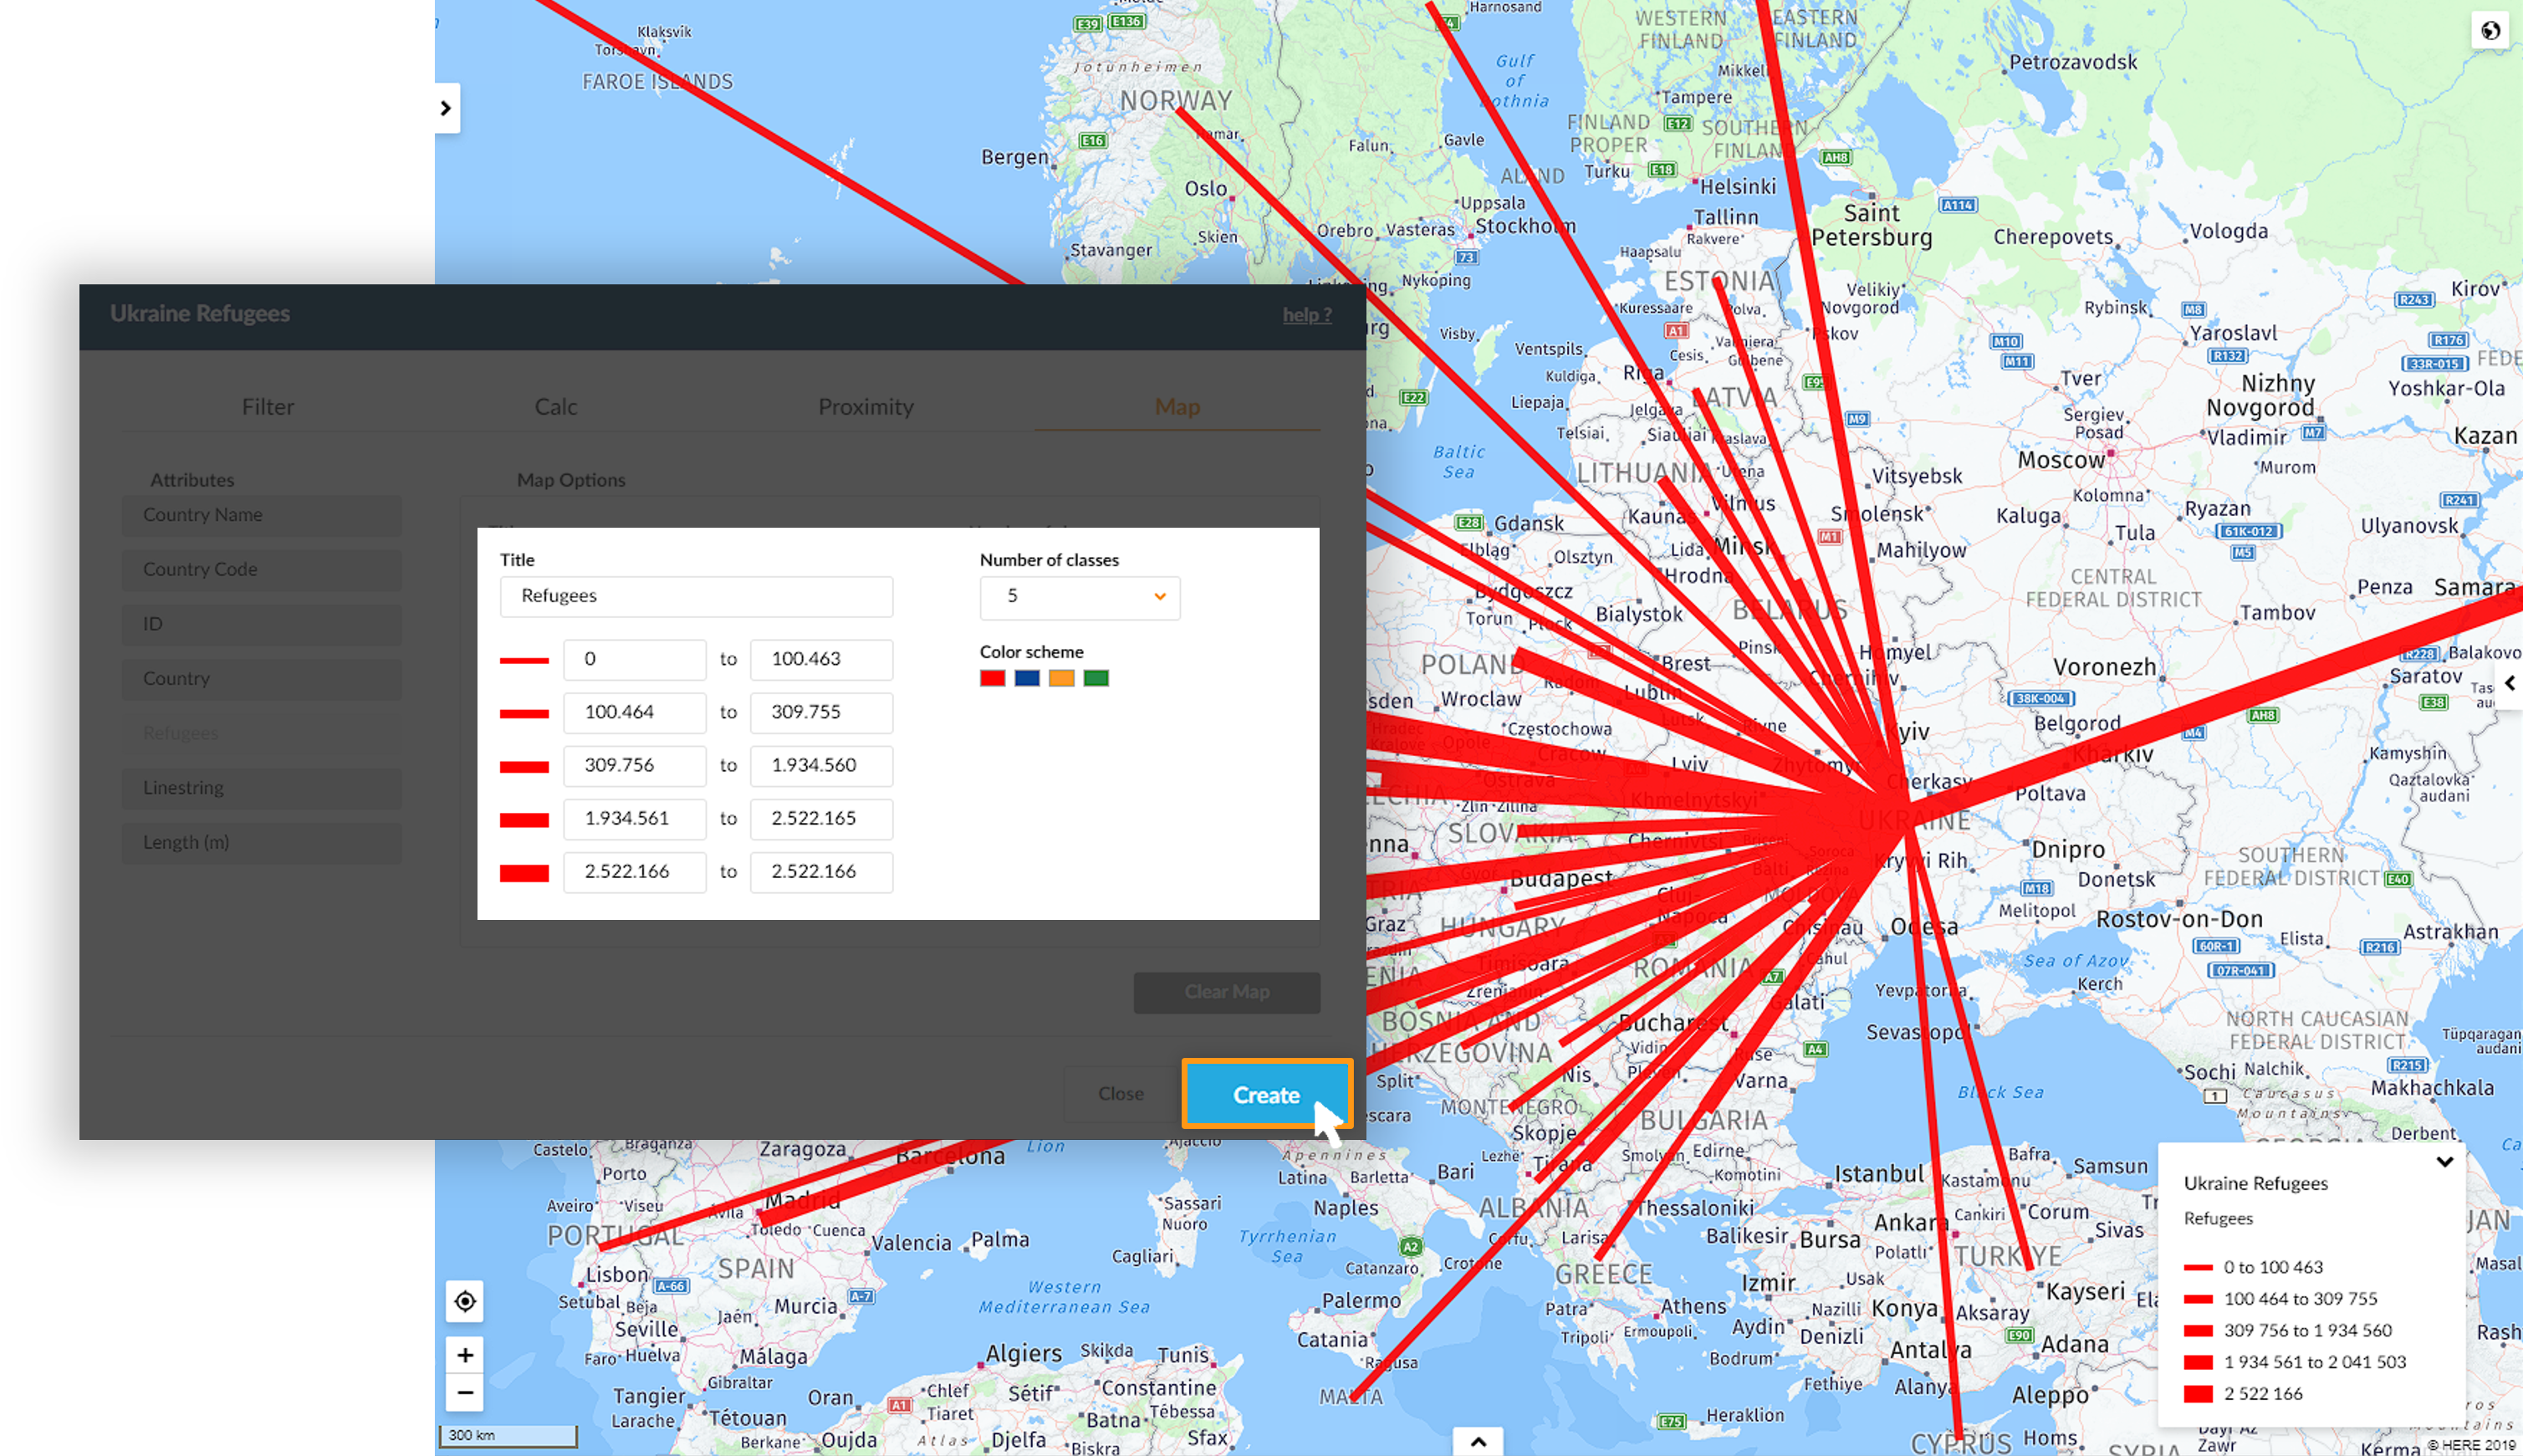
7.7 Proportional Line Map
In the map console, if you drag & drop a value attribute of a line layer, and that layer has less than 50 lines, instead of a ranged map it will be created a proportional line map.