Contents
2. Add Your Own Data
![]() Updated
by Mapidea Team
Updated
by Mapidea Team
With Mapidea, you can add your own data by dragging & dropping to the map.
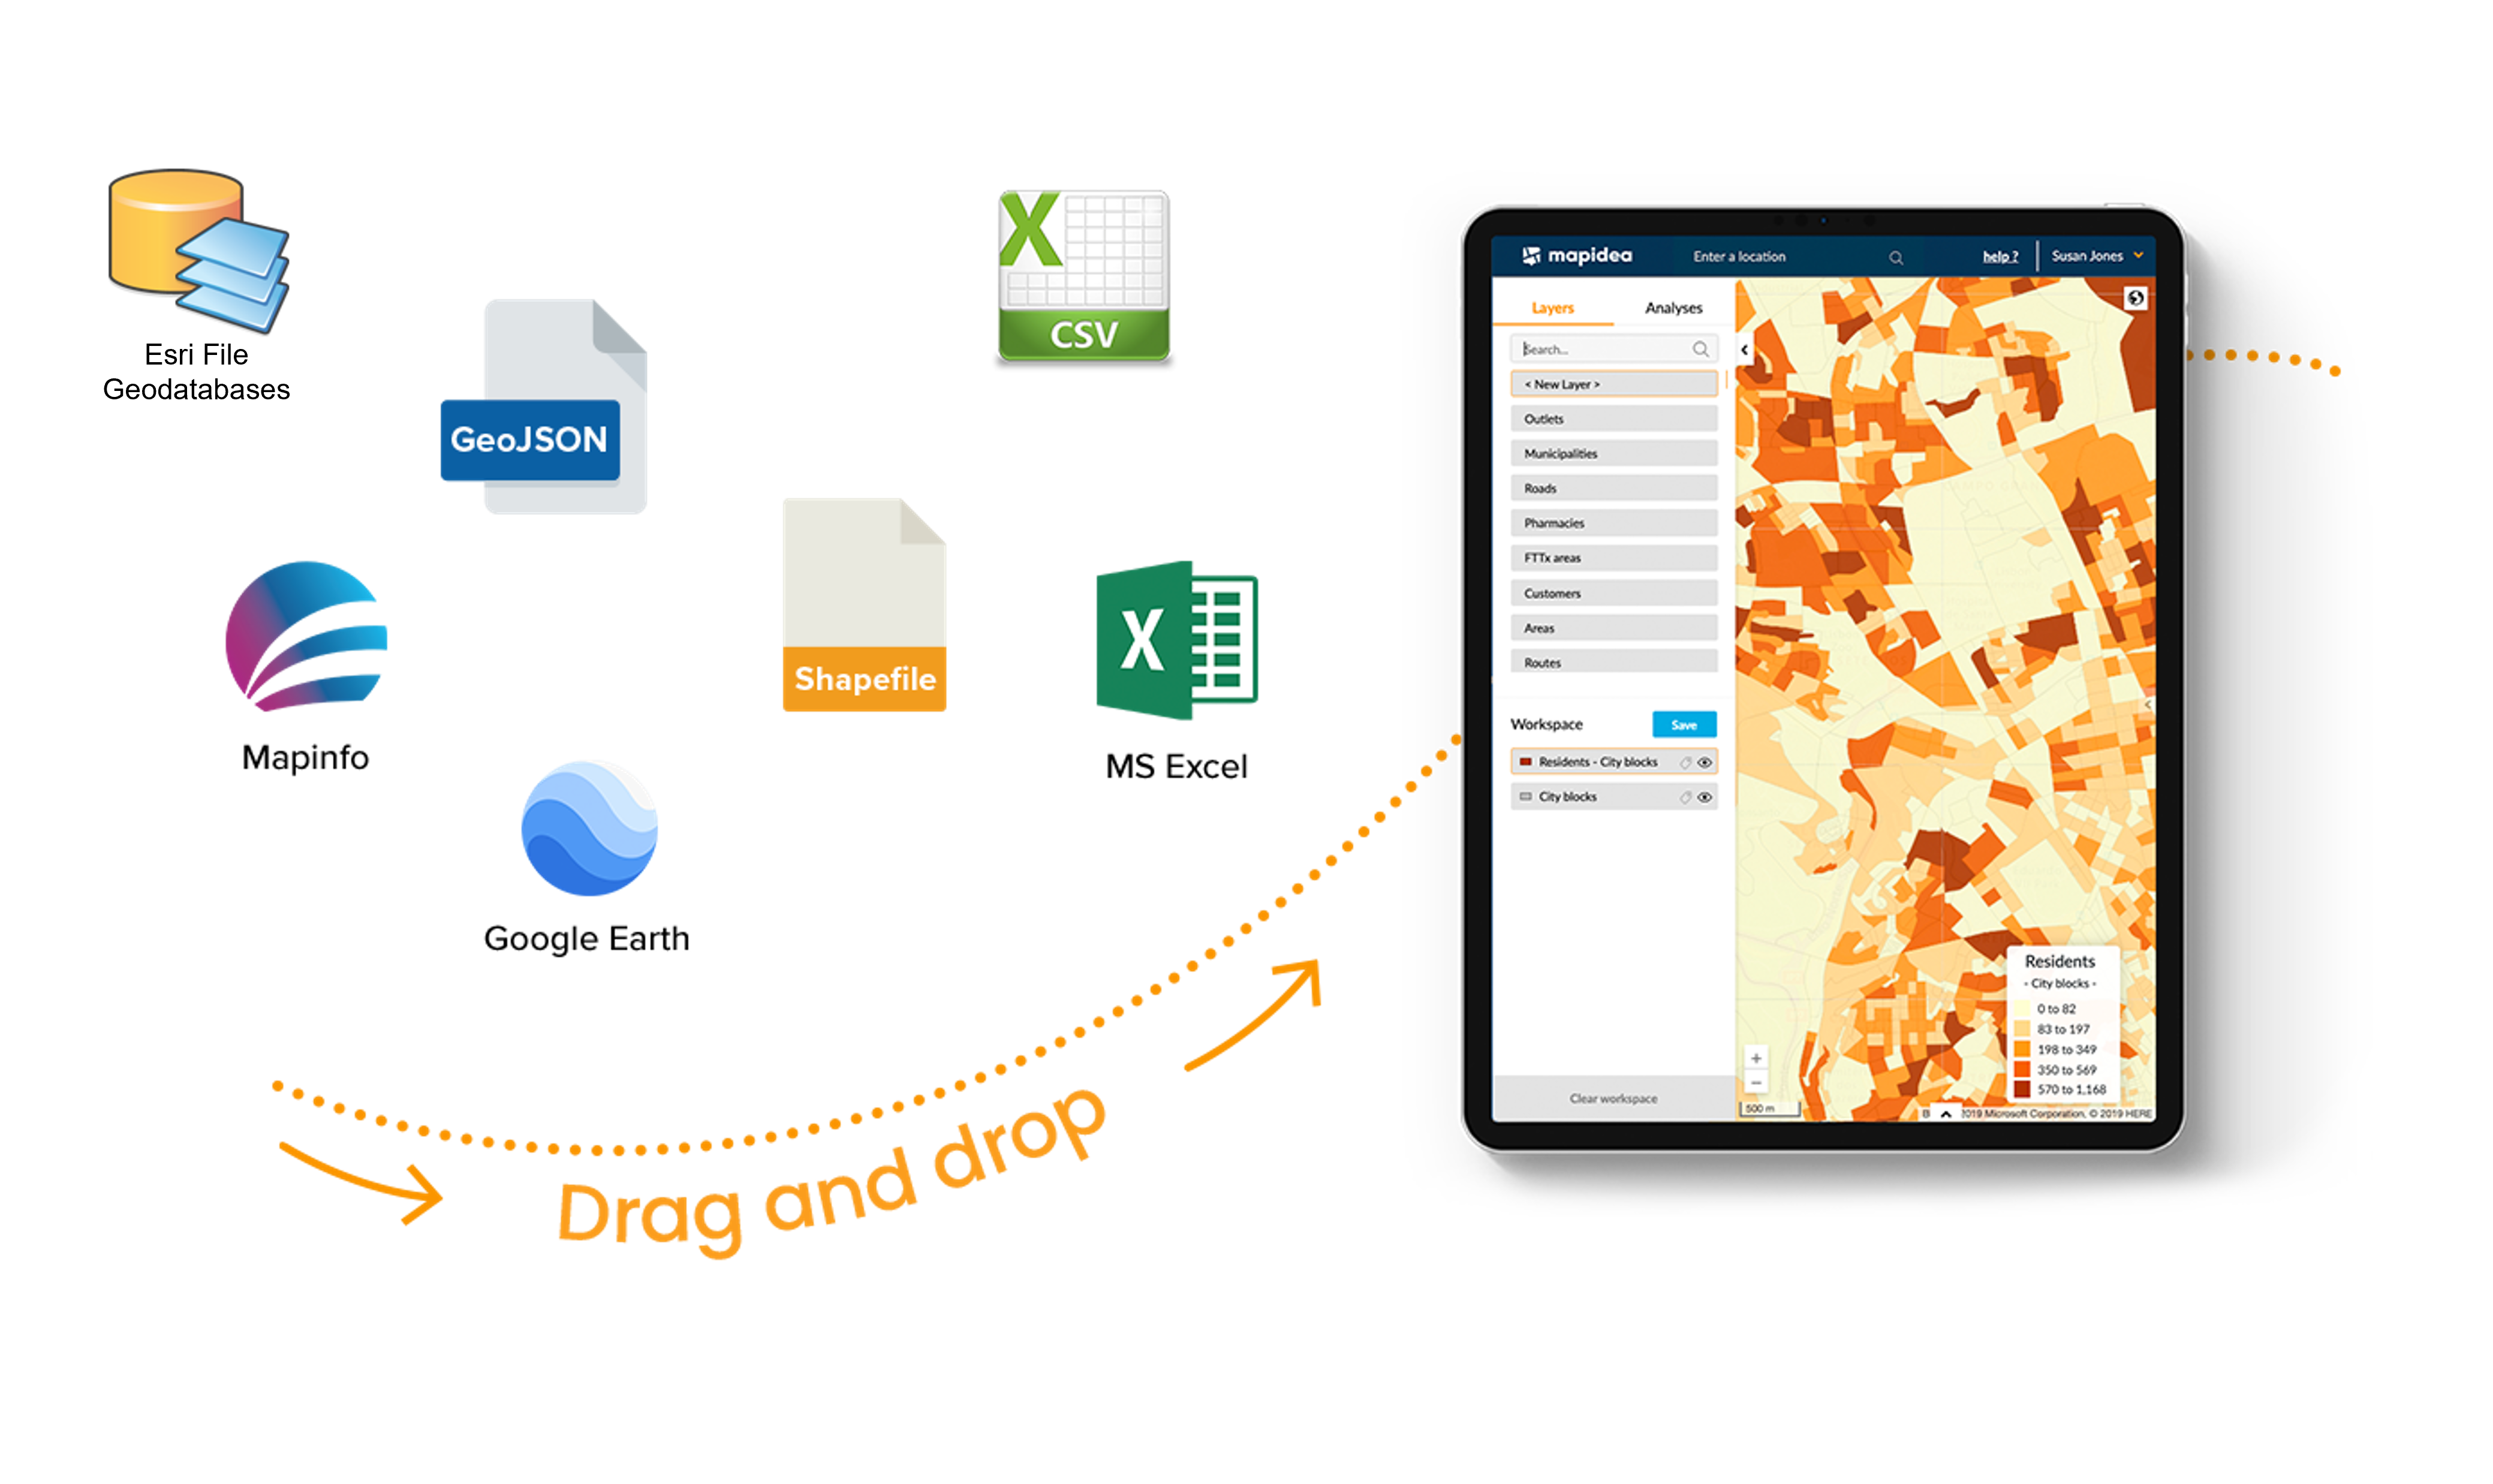
Mapidea supports the folowing formats:
- GeoJSON;
- Mapinfo;
- Shapefile;
- Excel and CSV;
- Google Earth;
- Esri File Geodatabases (only on administration area)
2.1 Adding the data
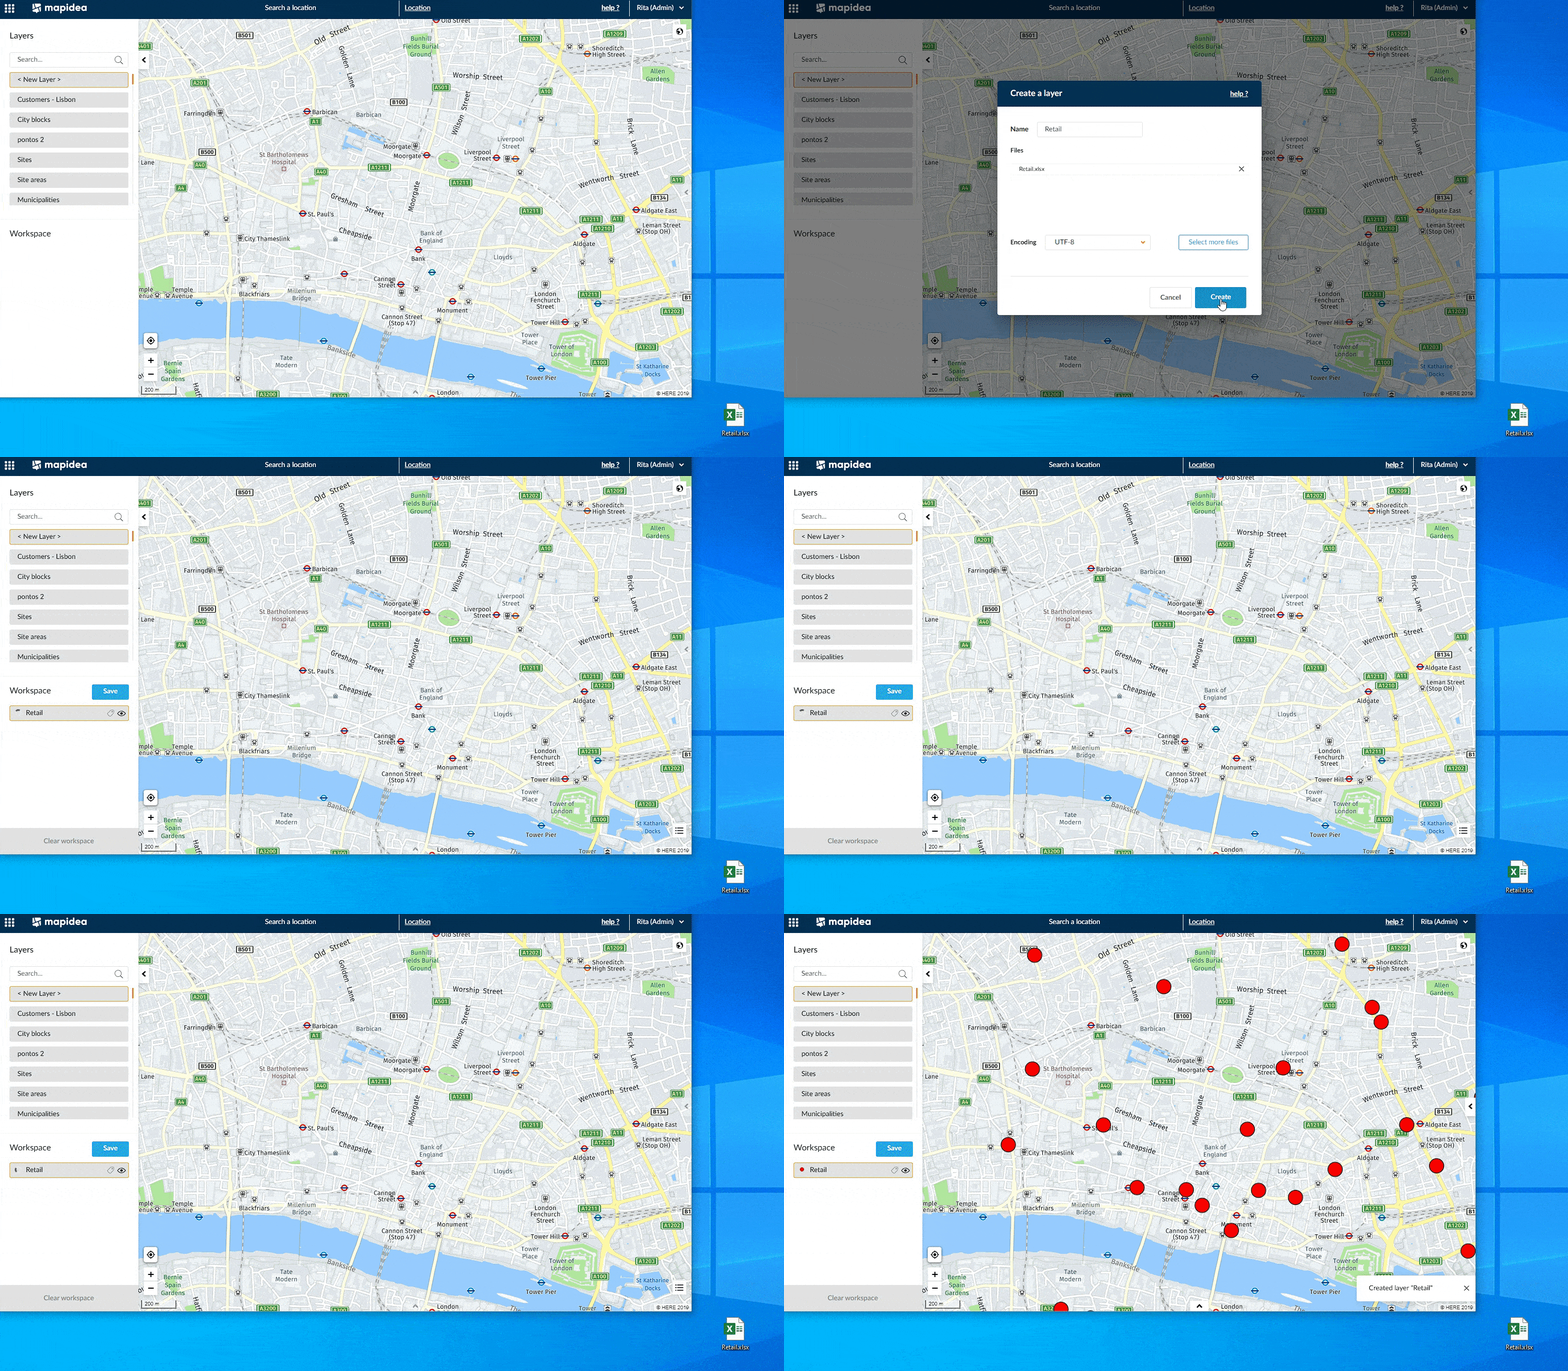
In the application you have the option to add any data that has geographical information. To do this drag and drop the file directly on the map:
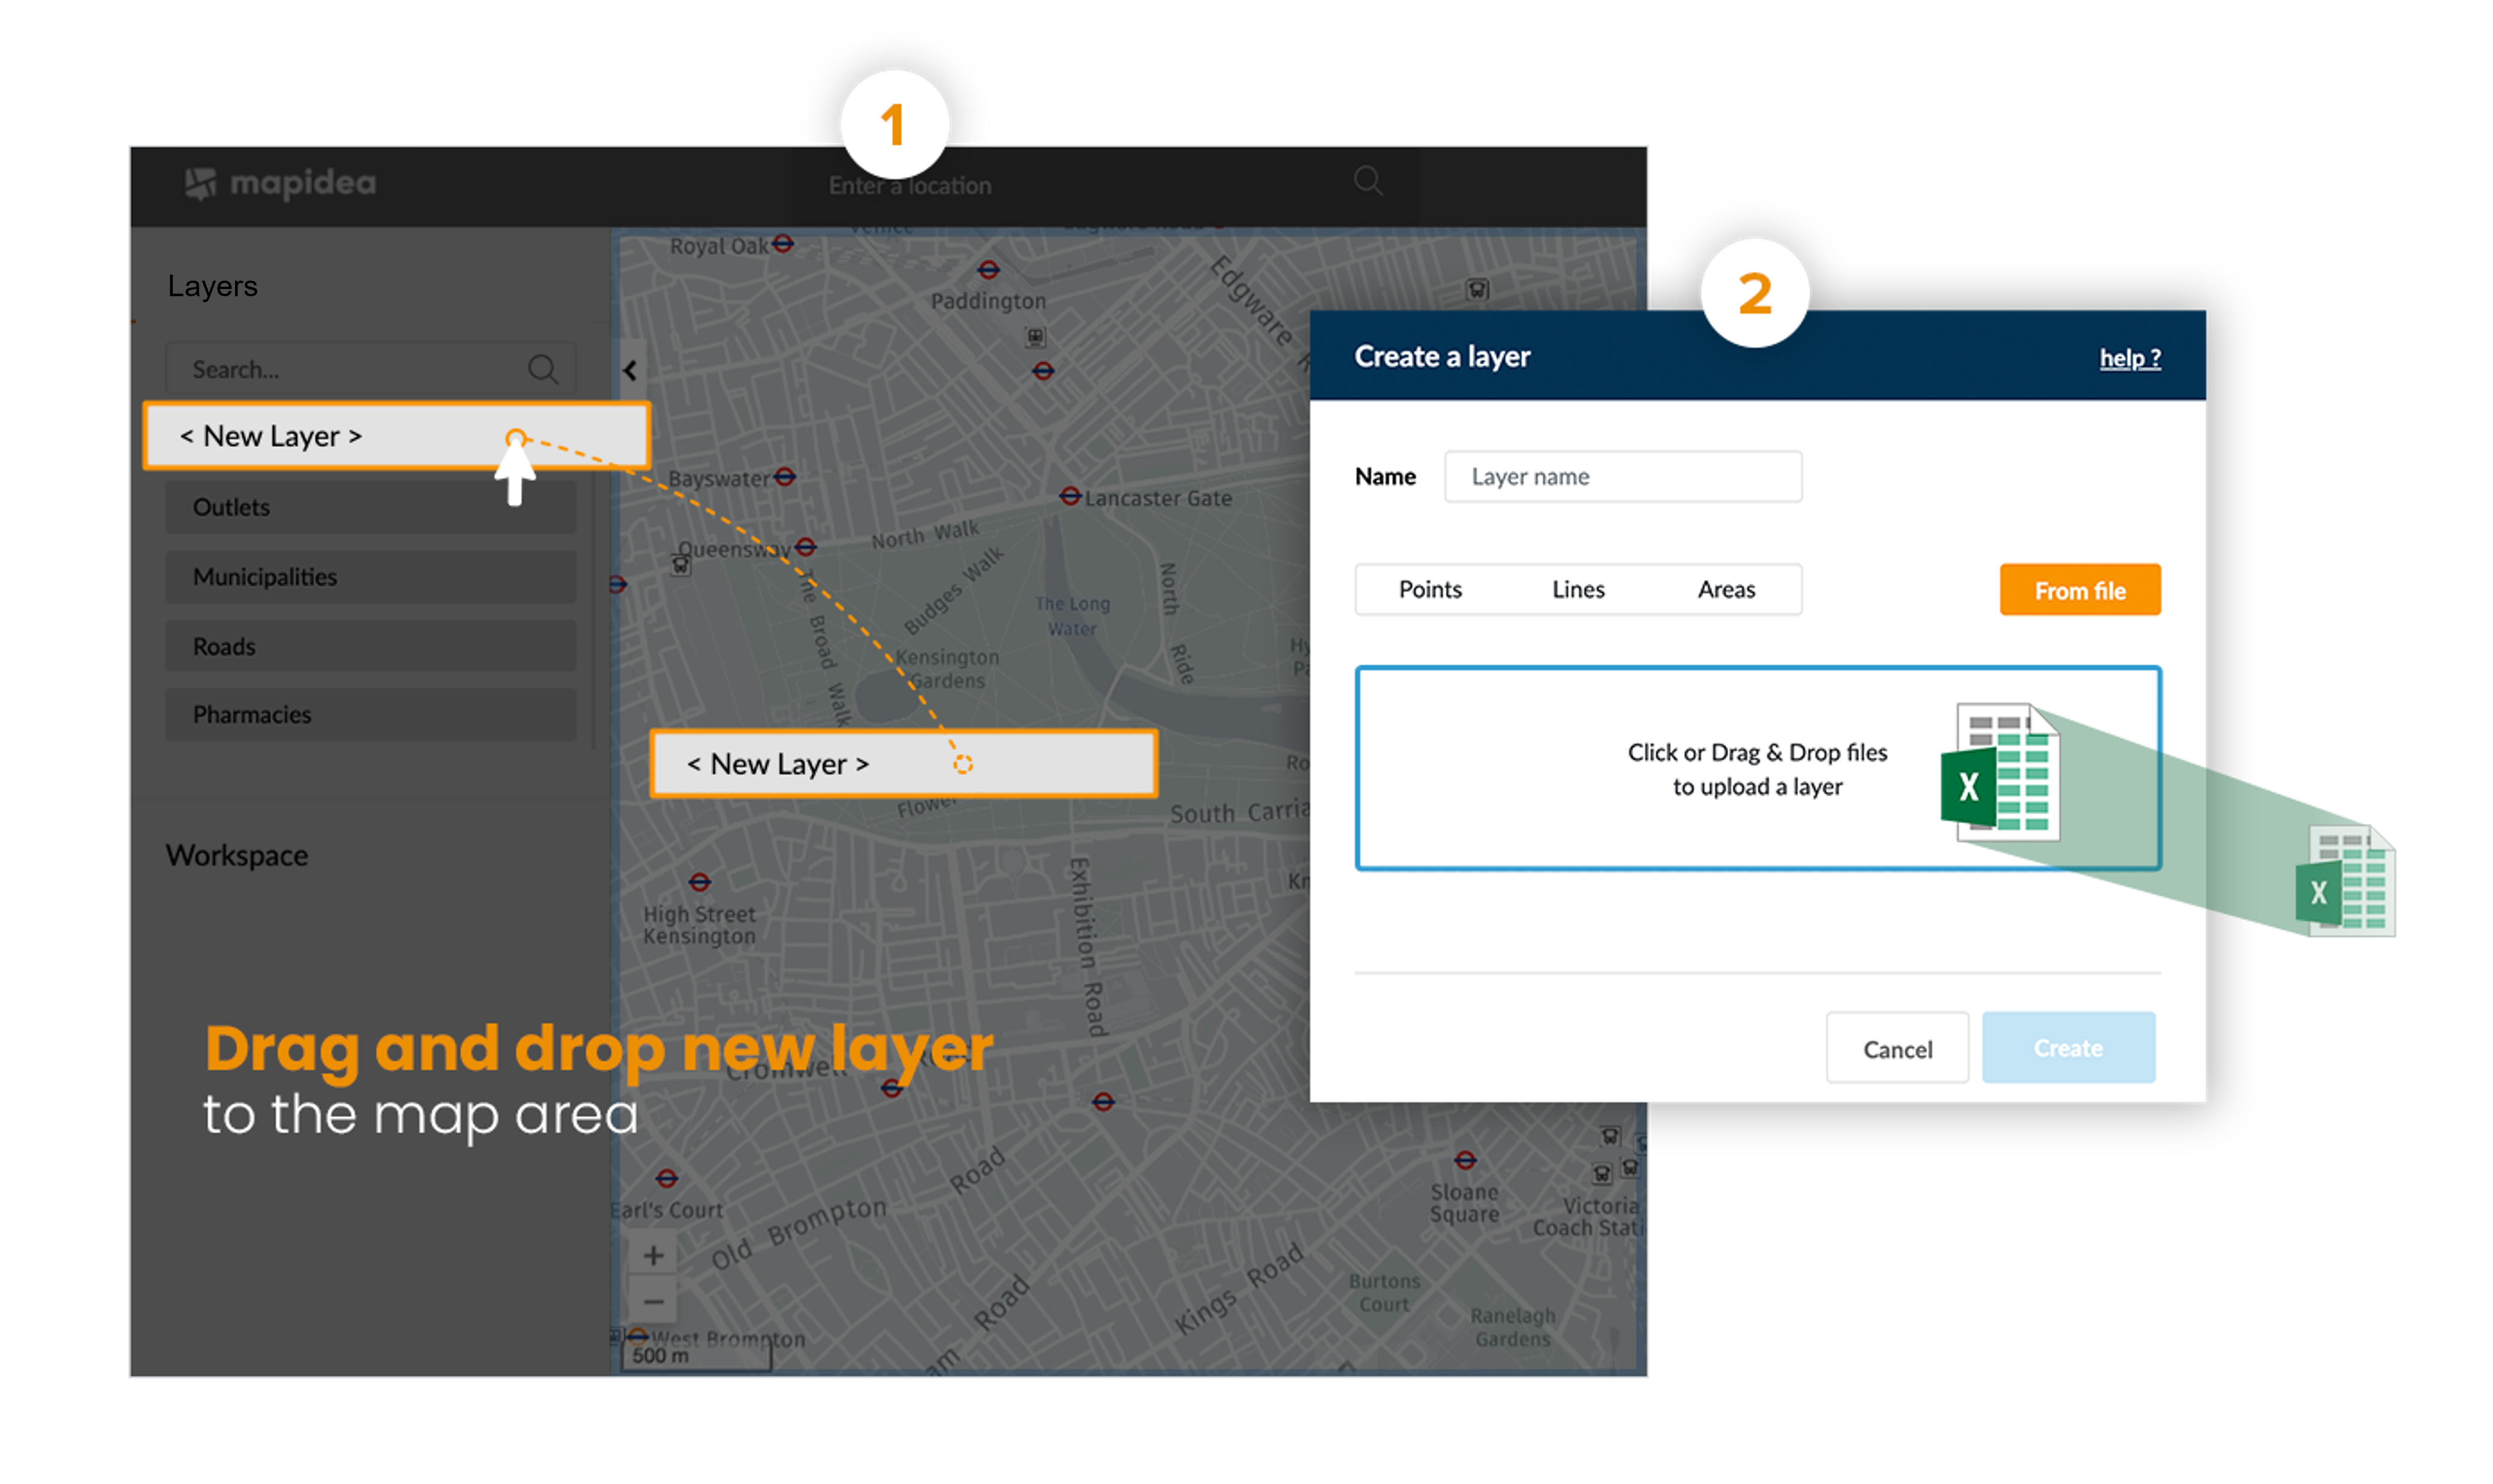
Other option is to click on the "from file" button and drag and drop the file(s) to the dashed area:
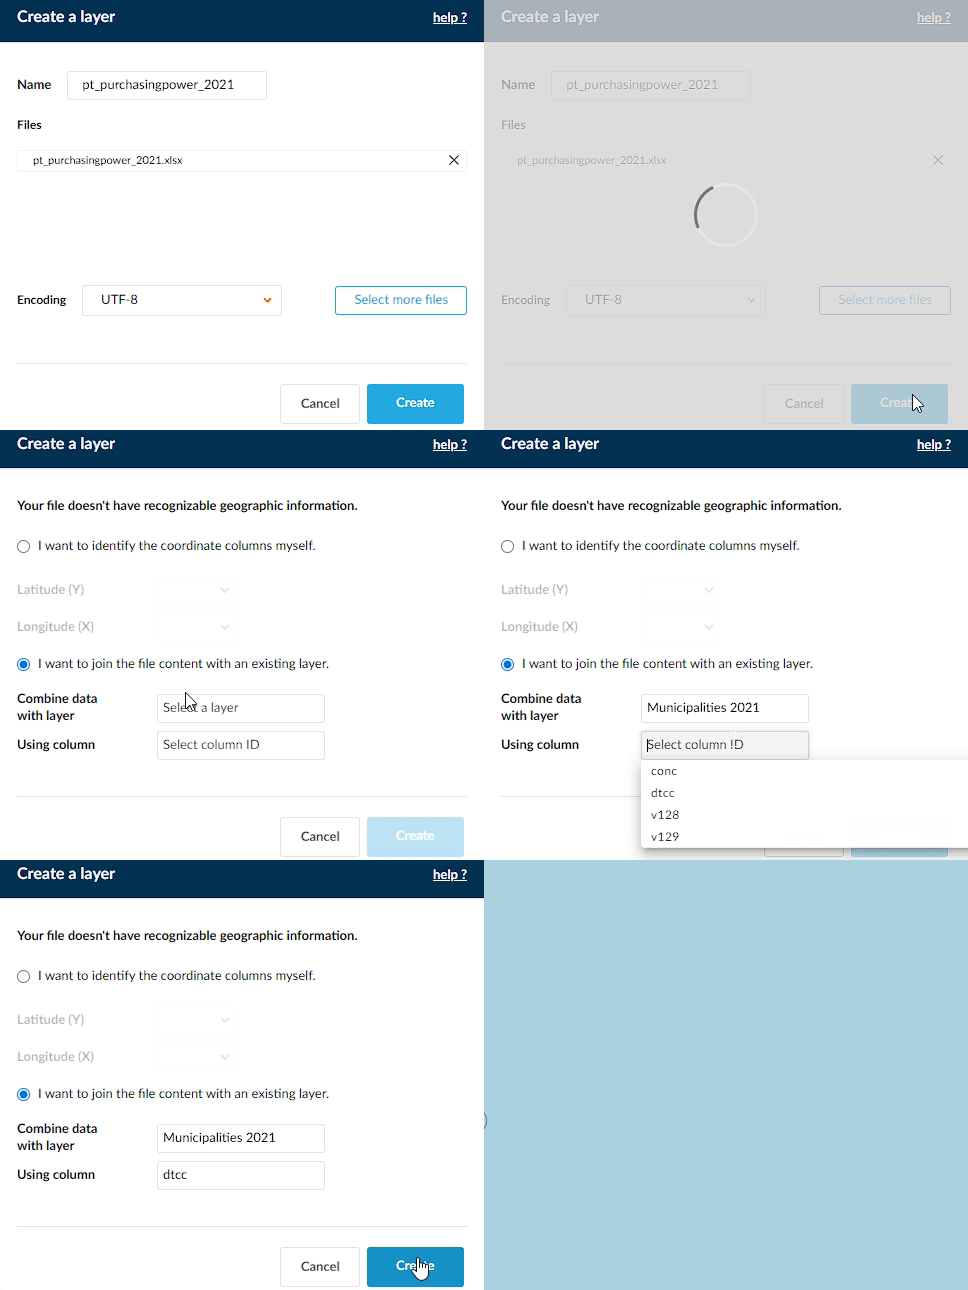
When adding an excel or .csv file, with geographical information, it will appear a new console for you to choose which column has the geographical information or if you want to merge that data with an existing layer.

2.1.1 Adding columns
In Mapidea we can merge data that isn't in the application with layers that are available. To do this, drag and drop the data into the application and choose how you want to join the information.
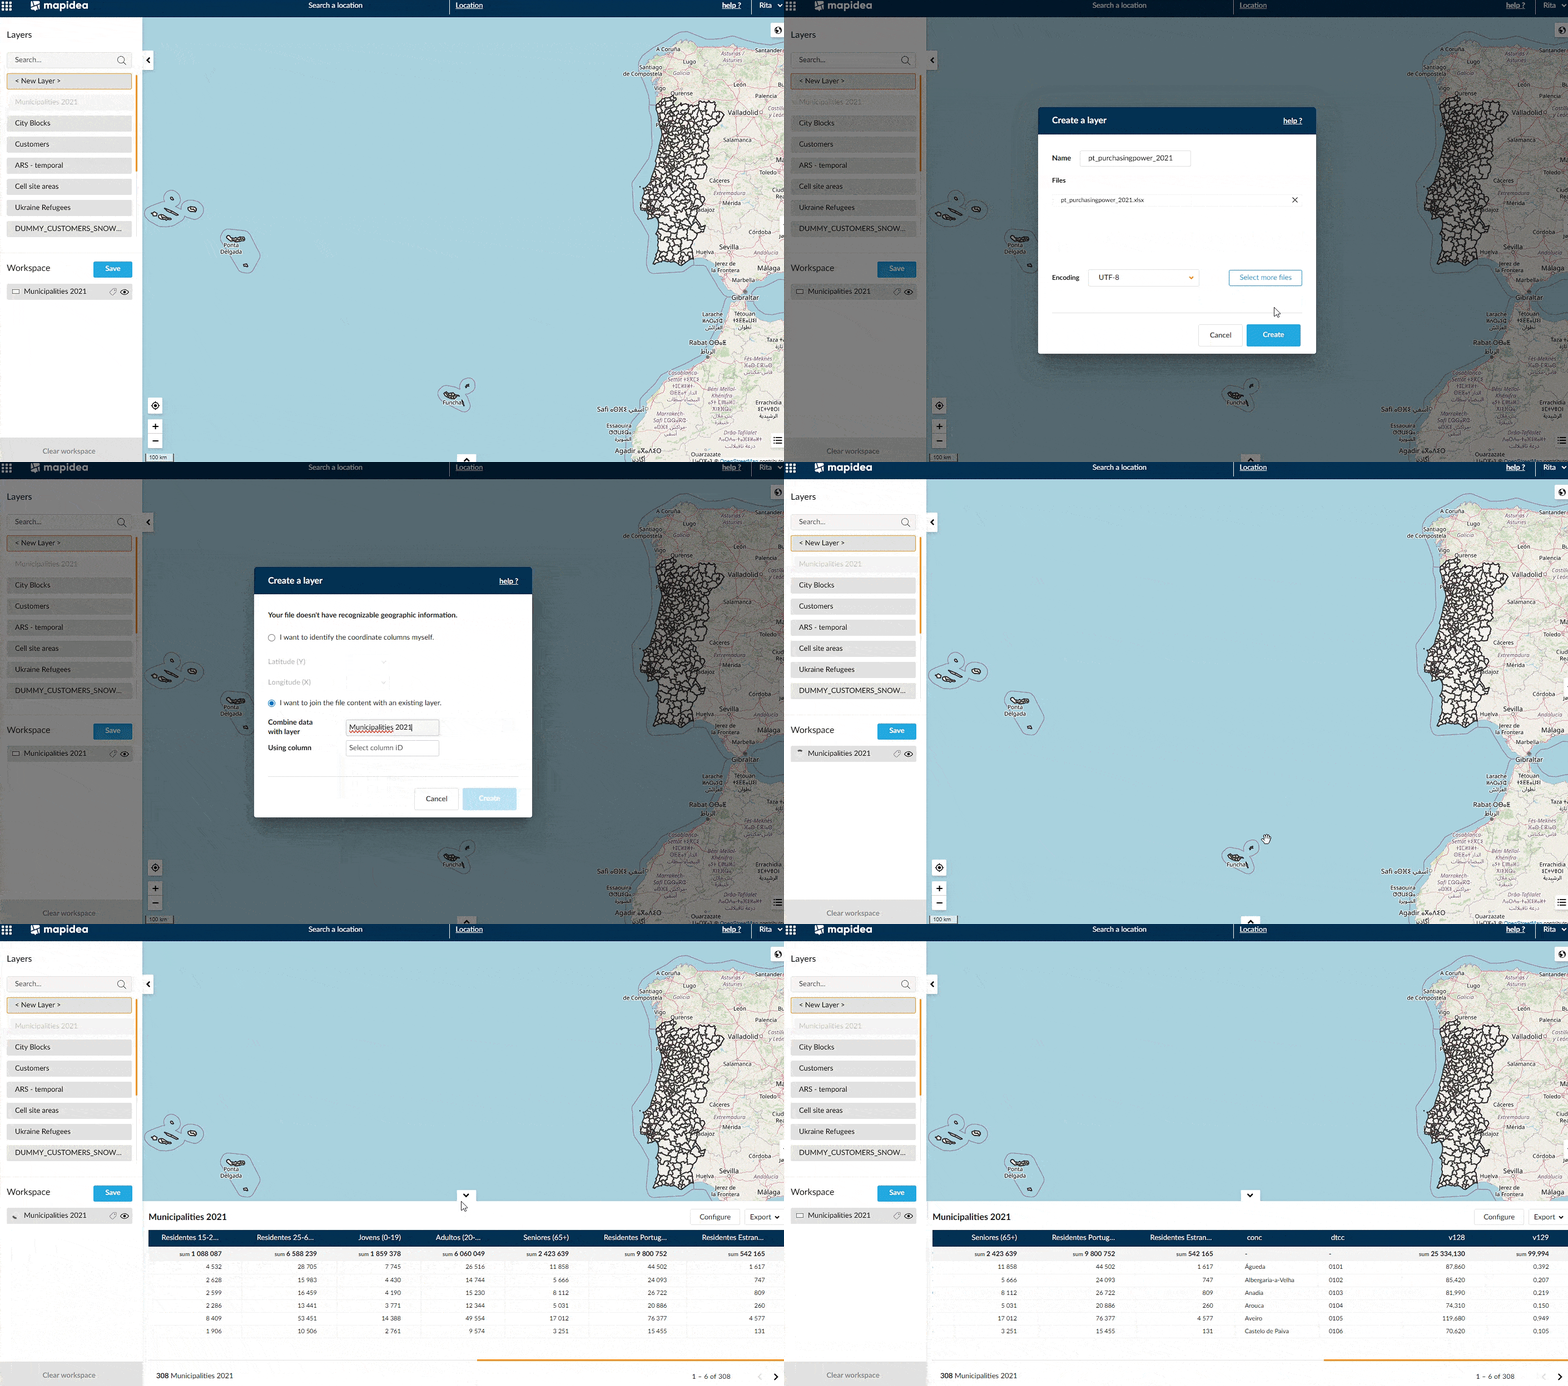
You'll need to choose the layer with which you want to combine the data you are joining and the column in your file that will be used to join the data (join with the table key of the layer in the application).
2.2 Styling data
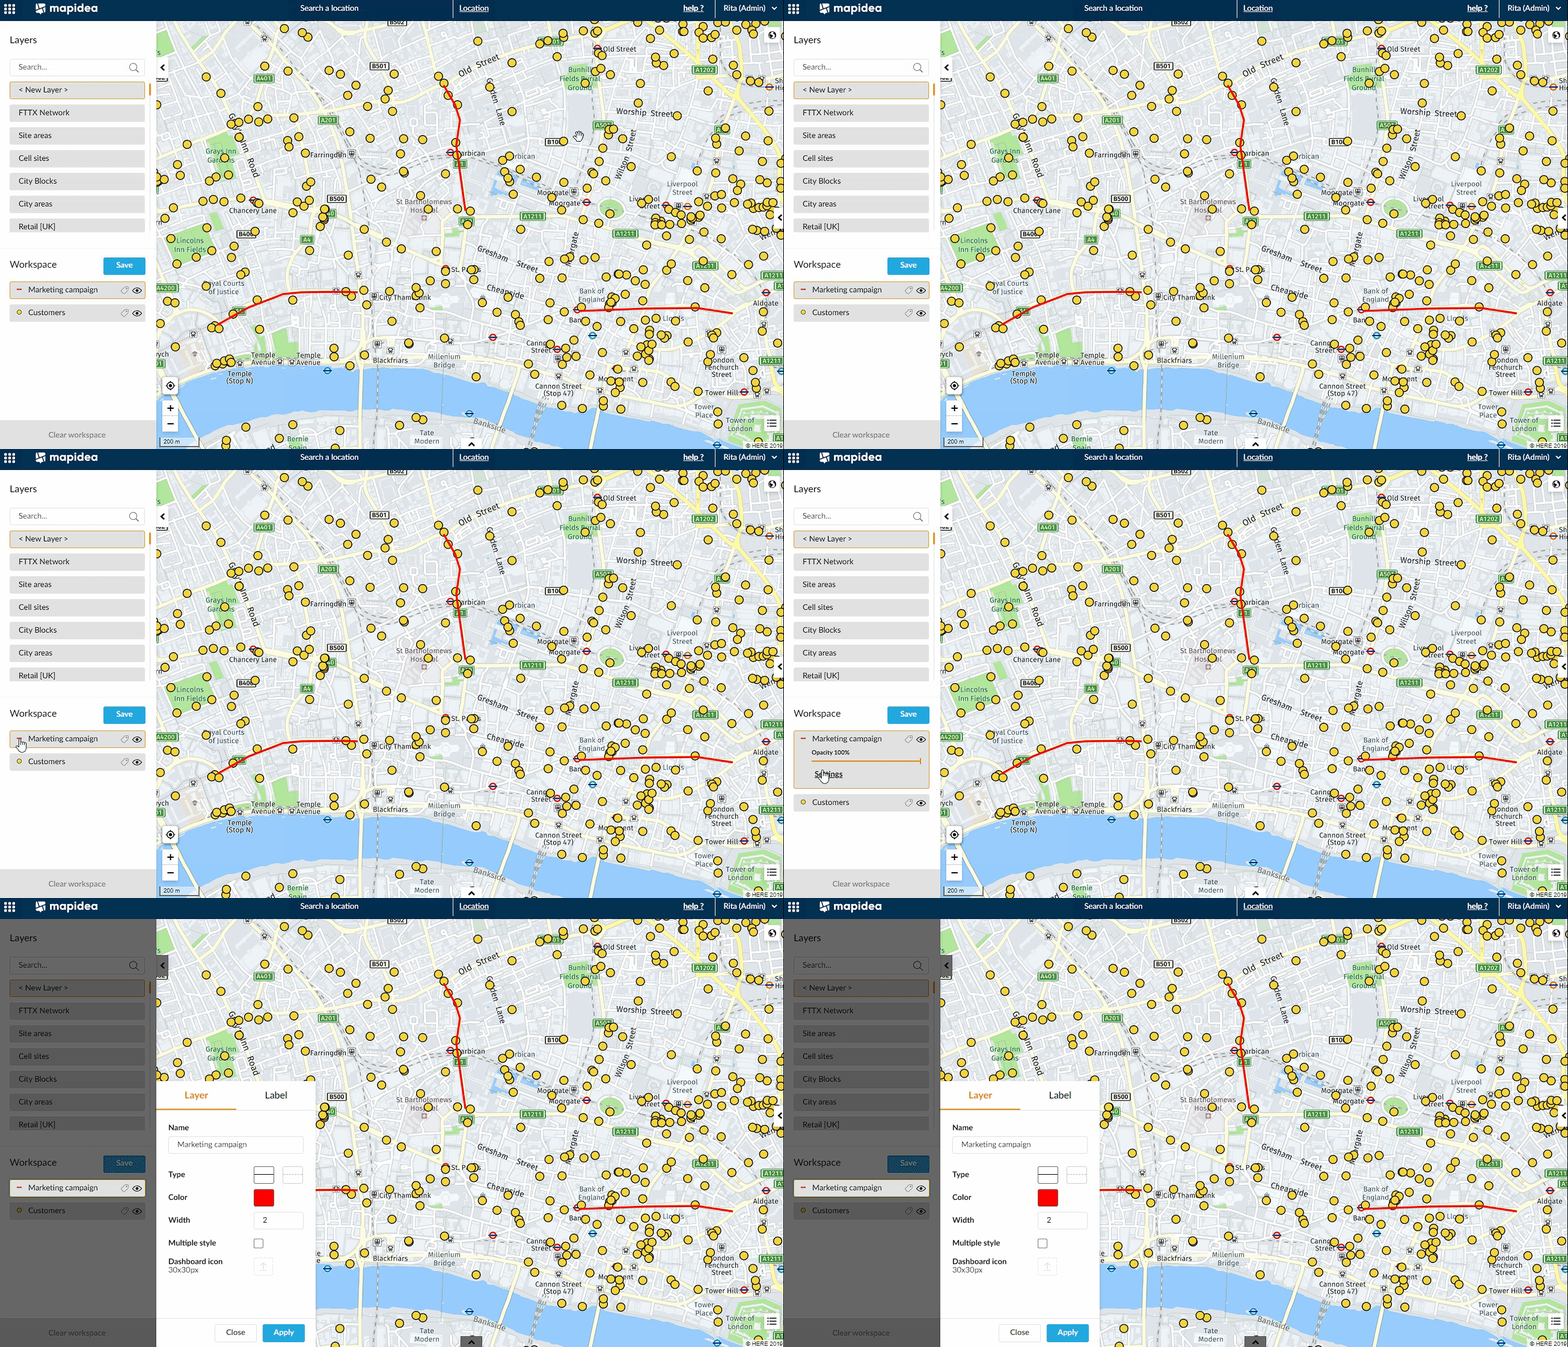
User loaded layers can have their style configured. Press the icon of the layer in the workspace, and under "Settings" you can visually customise how they will look.
2.2.1 Points
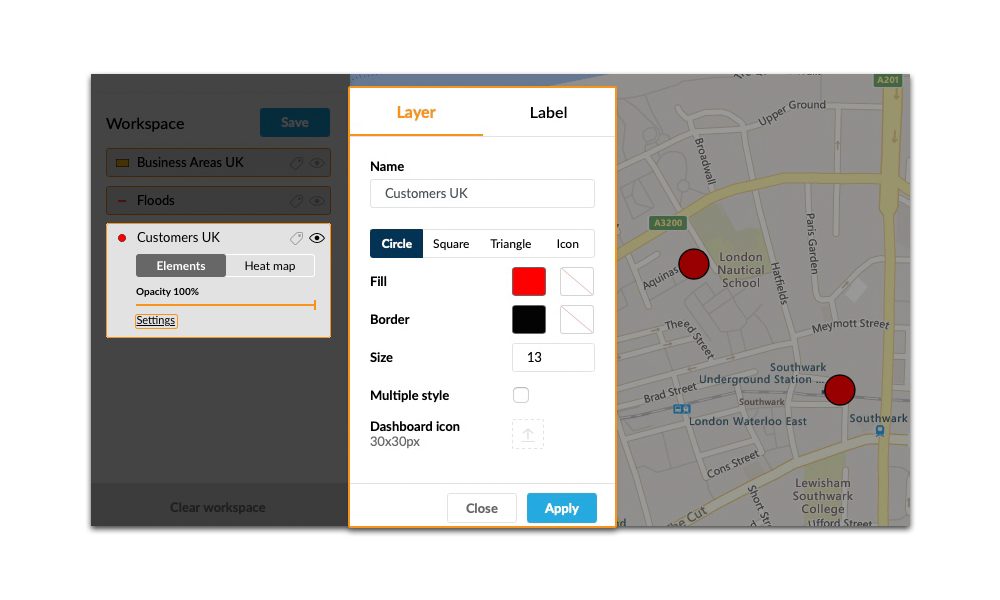
With points, you can change:
- Symbol type;
- Symbol size;
- Border and fill color;
- Level of opacity;
- Load a custom icon to be used on the map and in the Dashboard;
- Give multiple styles to a layer
2.2.2 Lines
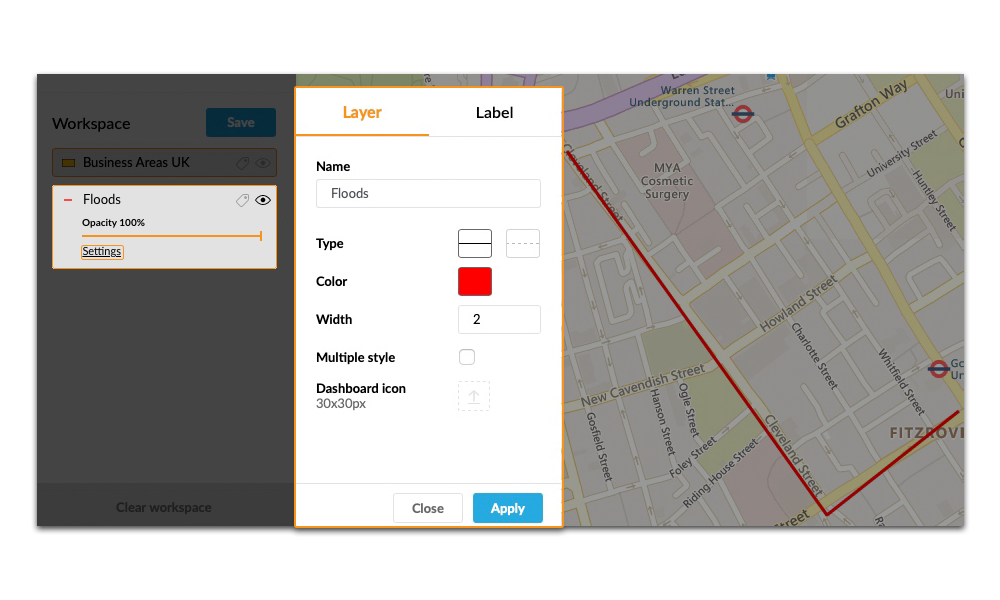
With lines, you can change:
- Line style;
- Line width;
- Line color;
- Load a custom icon to be used in the Dashboard;
- Give multiple styles to a layer
2.2.3 Polygons
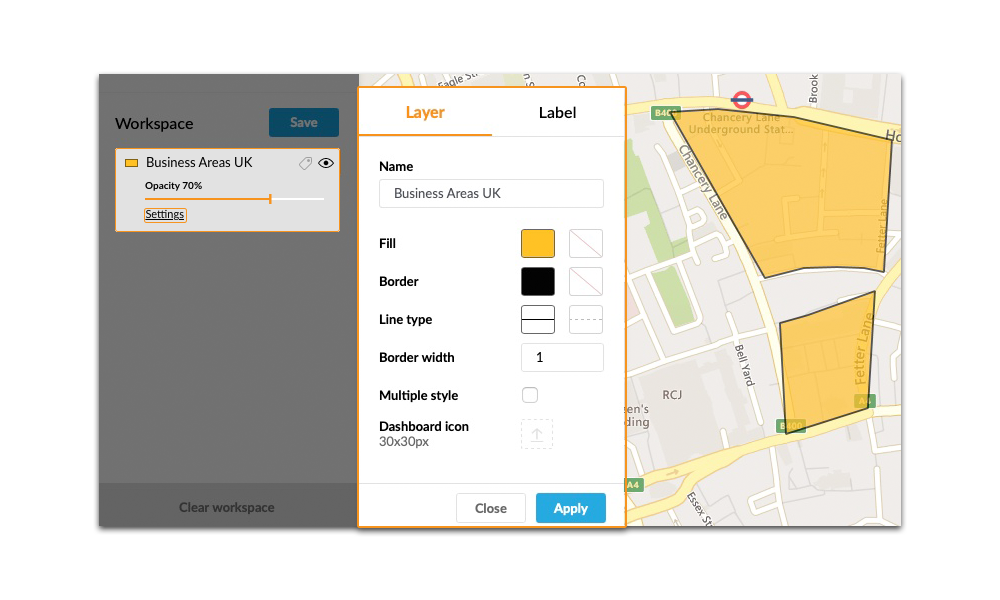
With polygons, you can change:
- Border style;
- Border width;
- Border and fill color;
- Level of opacity;
- Load a custom icon to be used in the Dashboard
2.2.4 Multiple Style Layer
With this feature, it’s possible to have multiple symbols on the same layer.
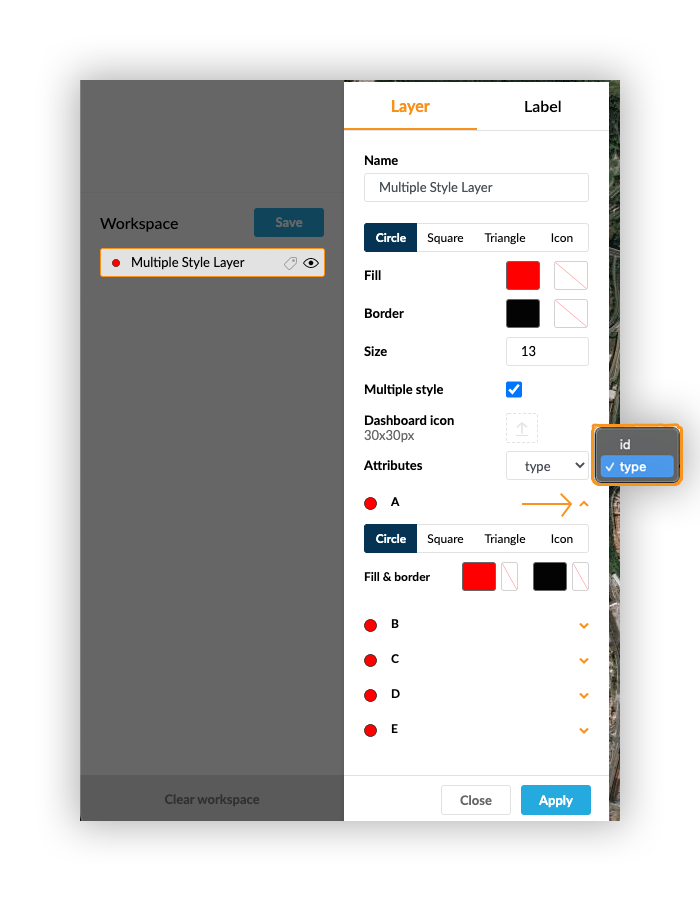
After the multiple style option is activated, an attribute combo appears, to select which attribute should be used. For each different value, there are individual options to configure an internal symbol or upload an external one.
For example, you can have all fast food locations in one layer, using one different symbol for each brand.
