3. Dashboard
![]() Updated
by Mapidea Team
Updated
by Mapidea Team
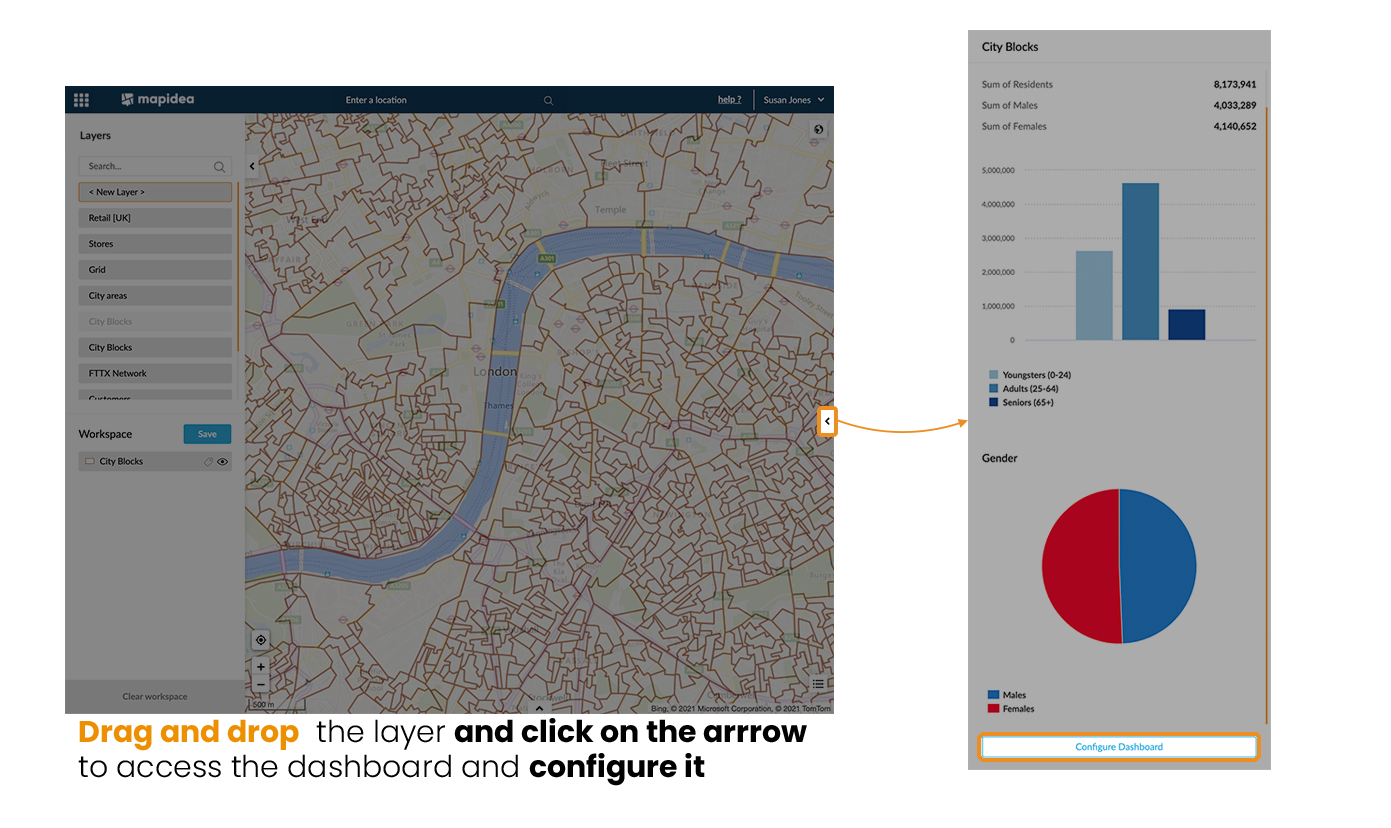
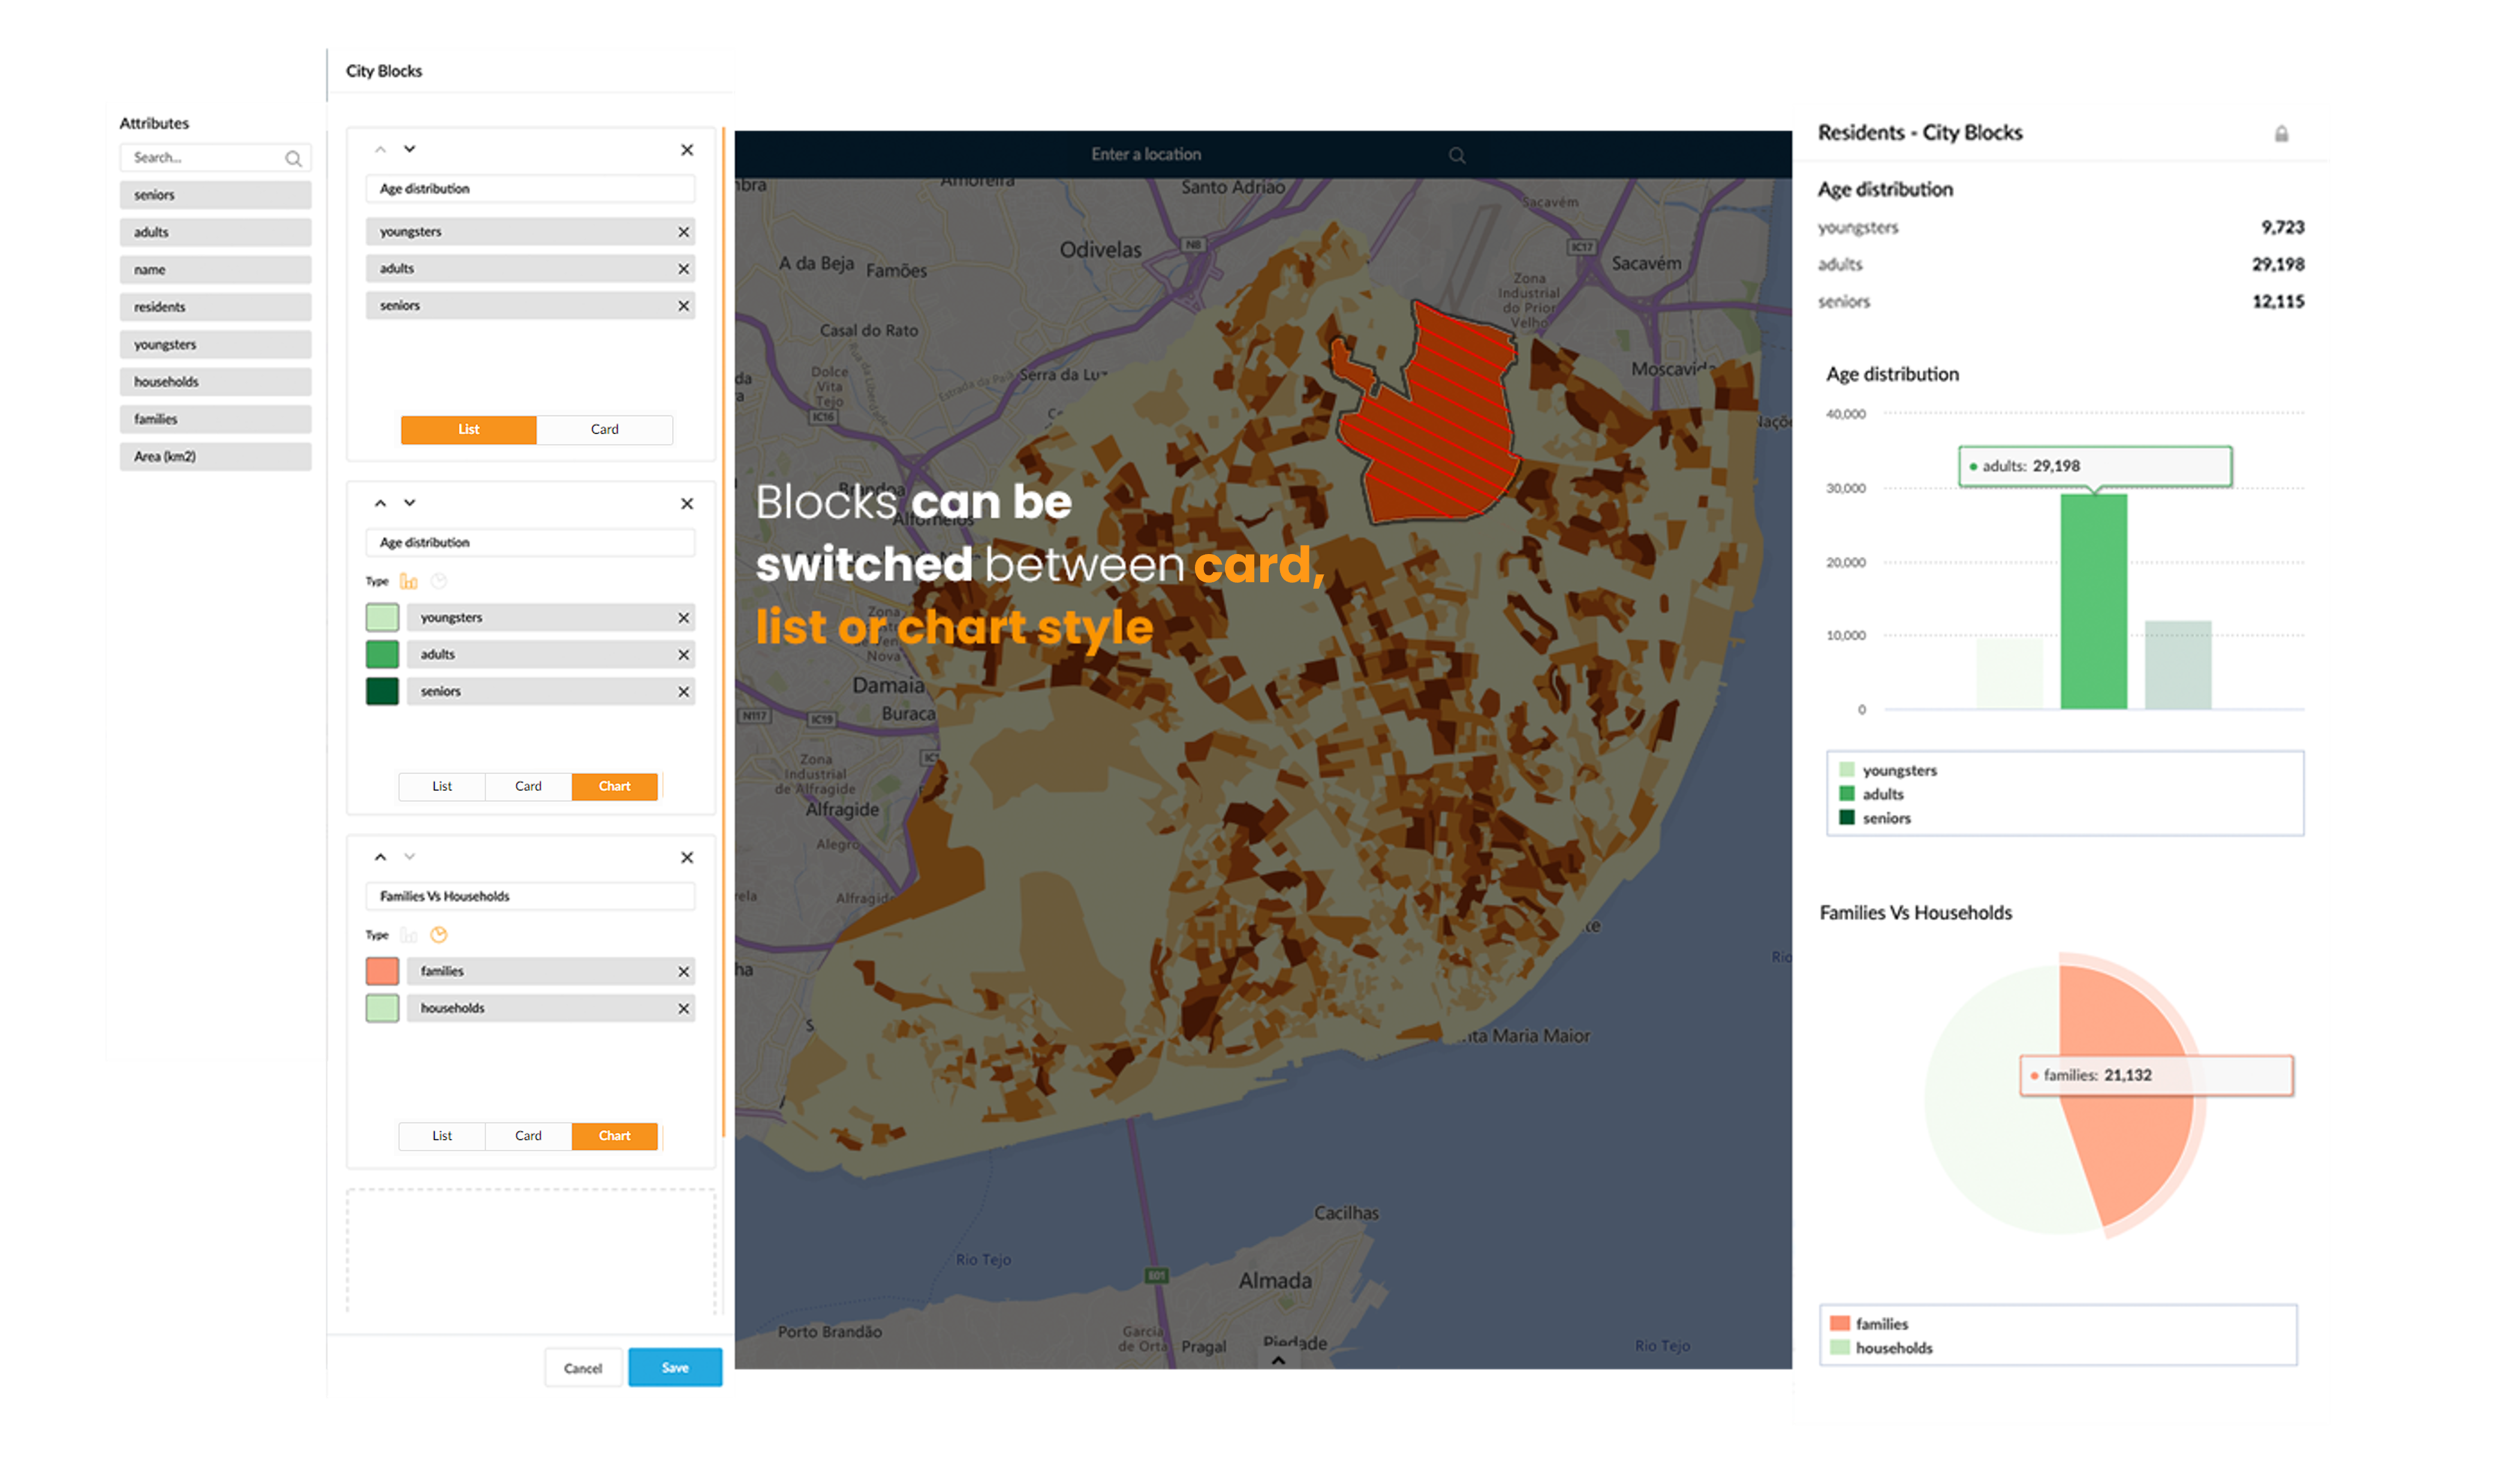
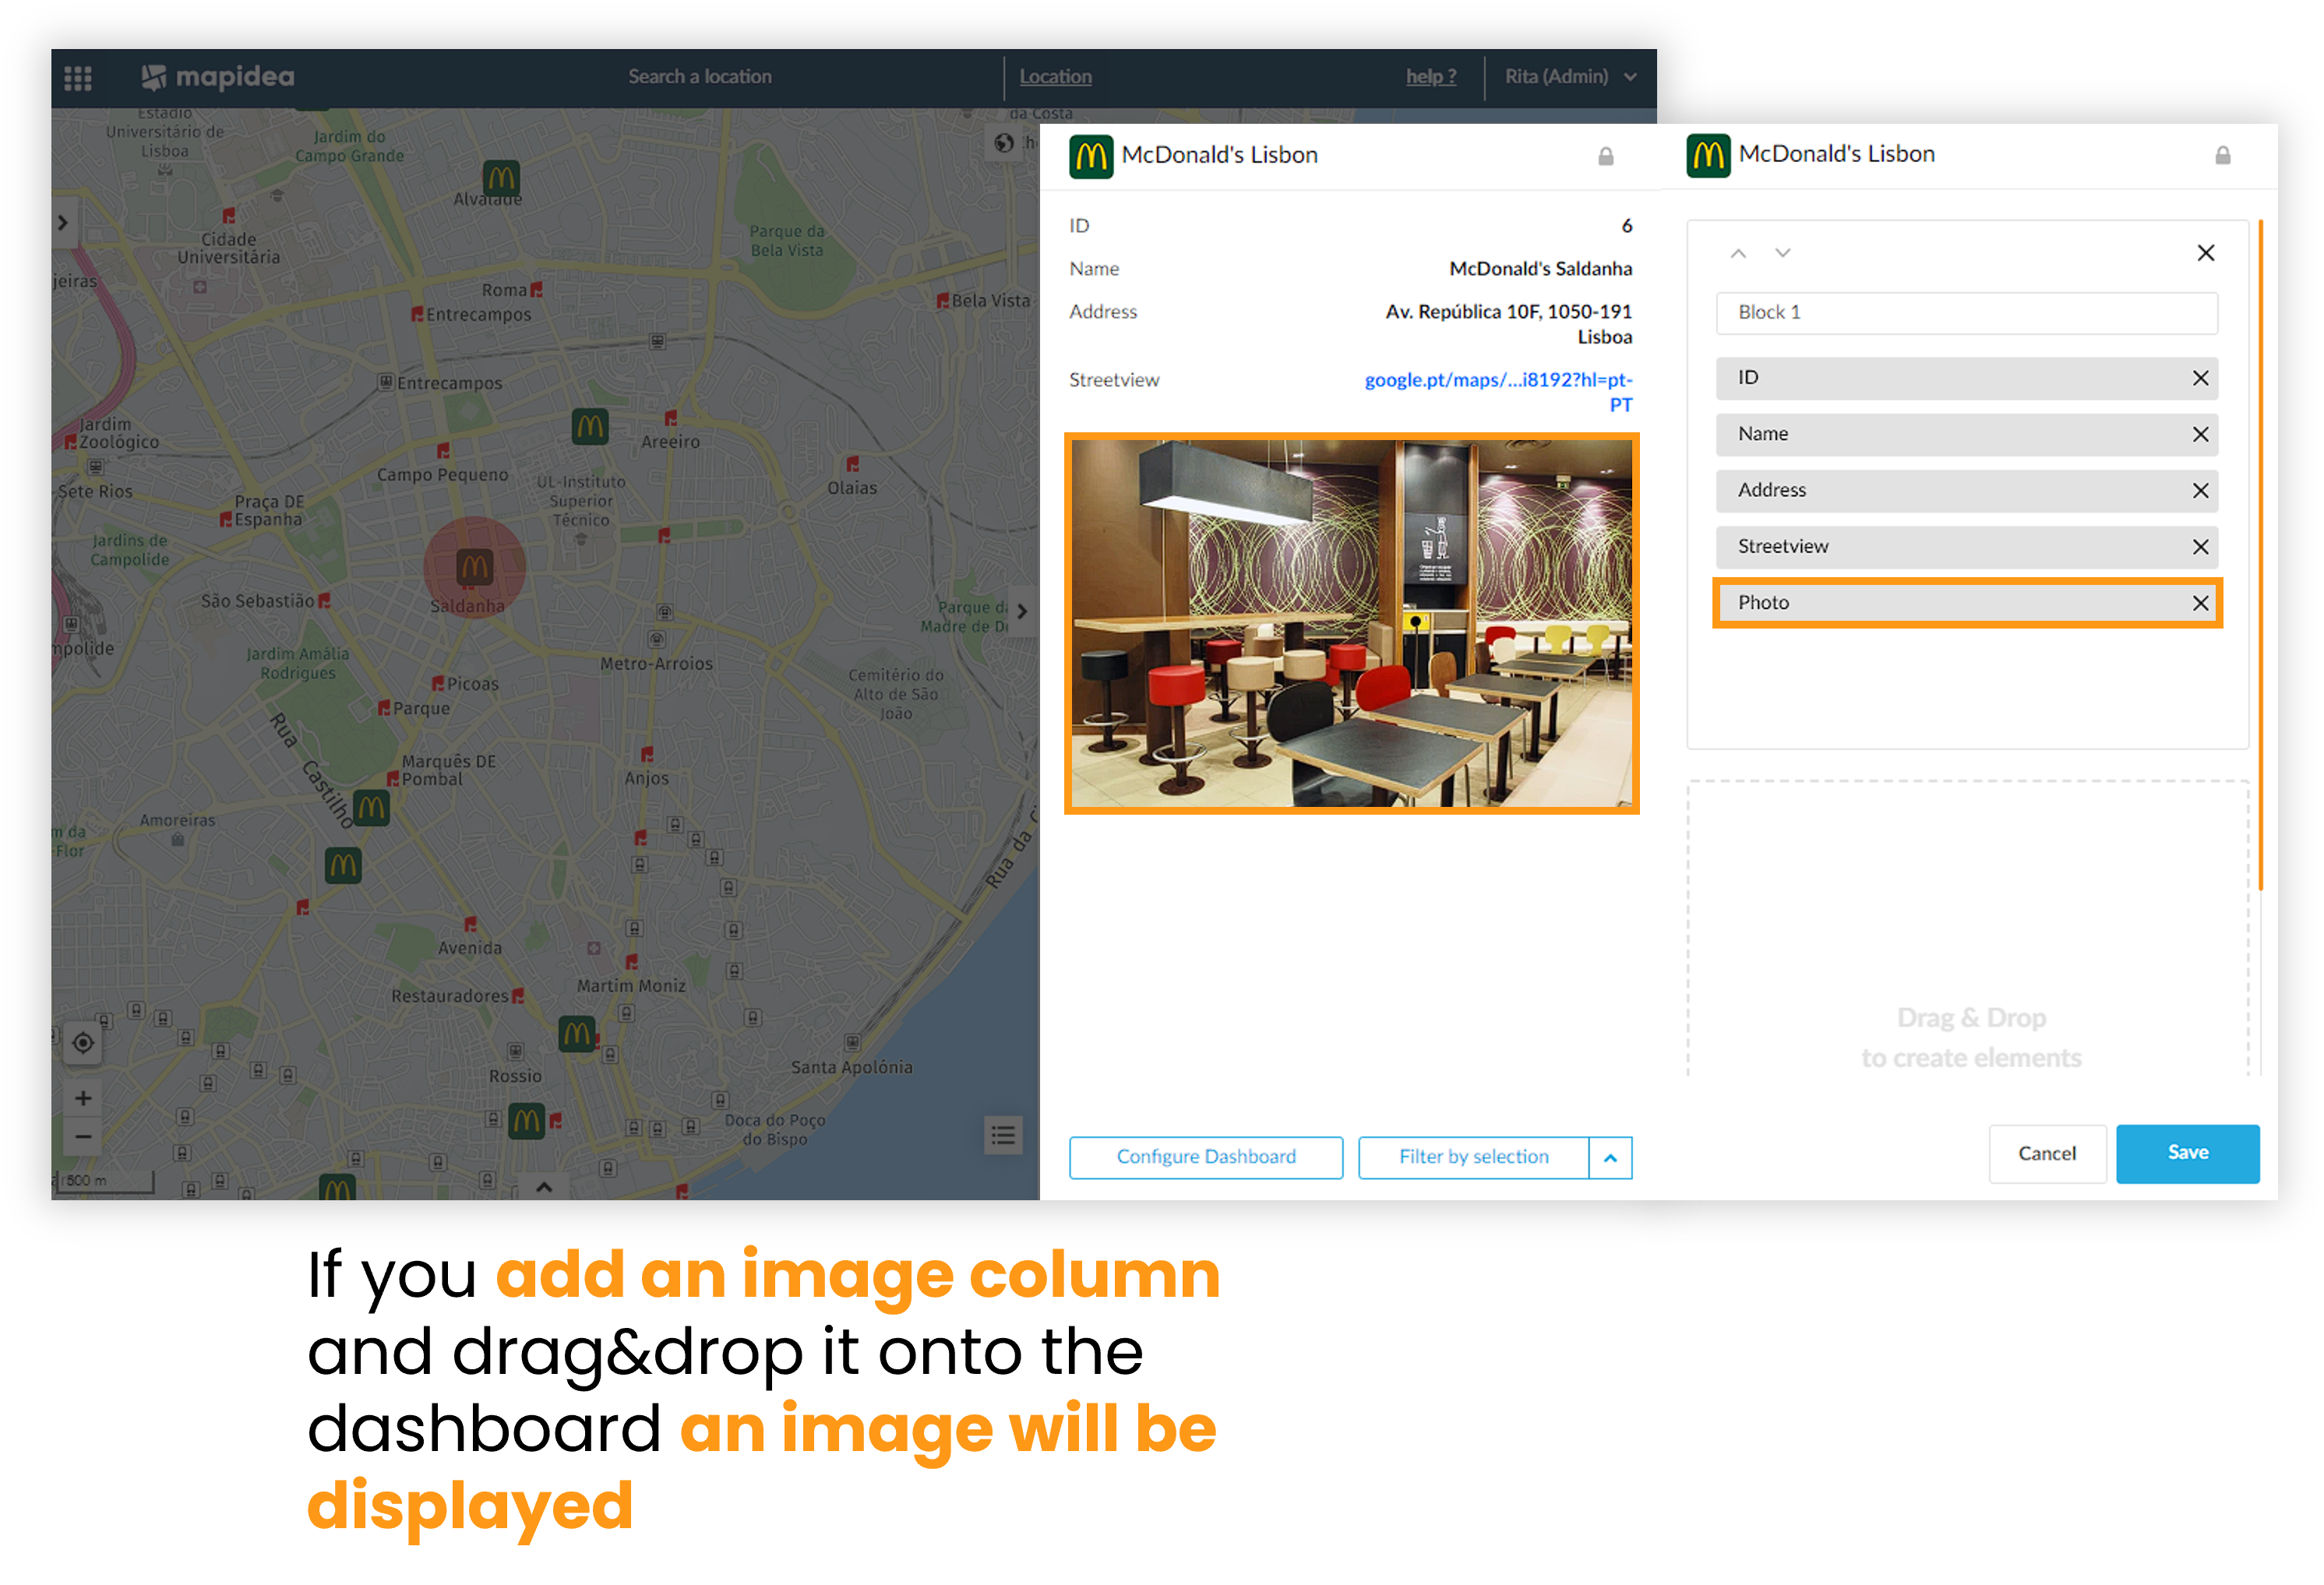
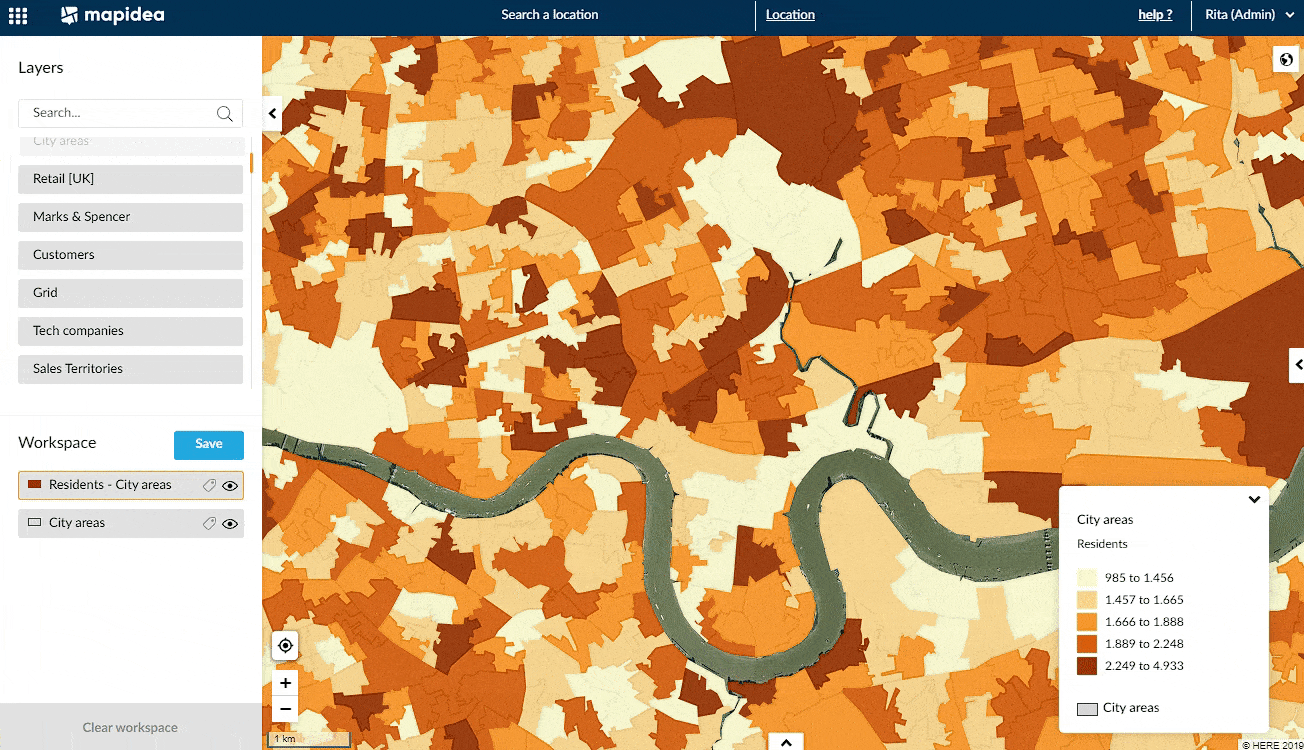
The dashboard tab allows to change the initial configuration of the data and the chart displayed. In the map, the dashboard is available when a user clicks over an element.
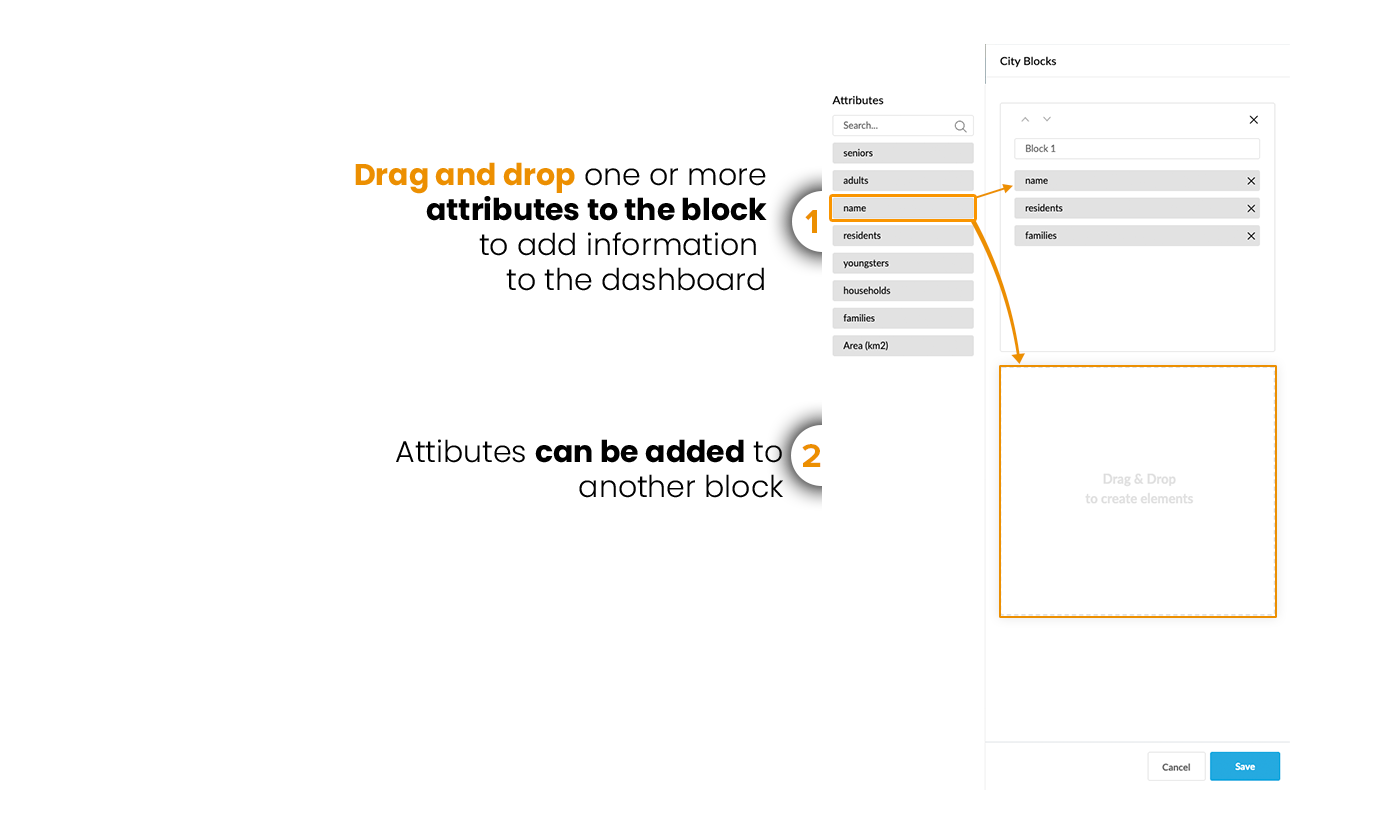
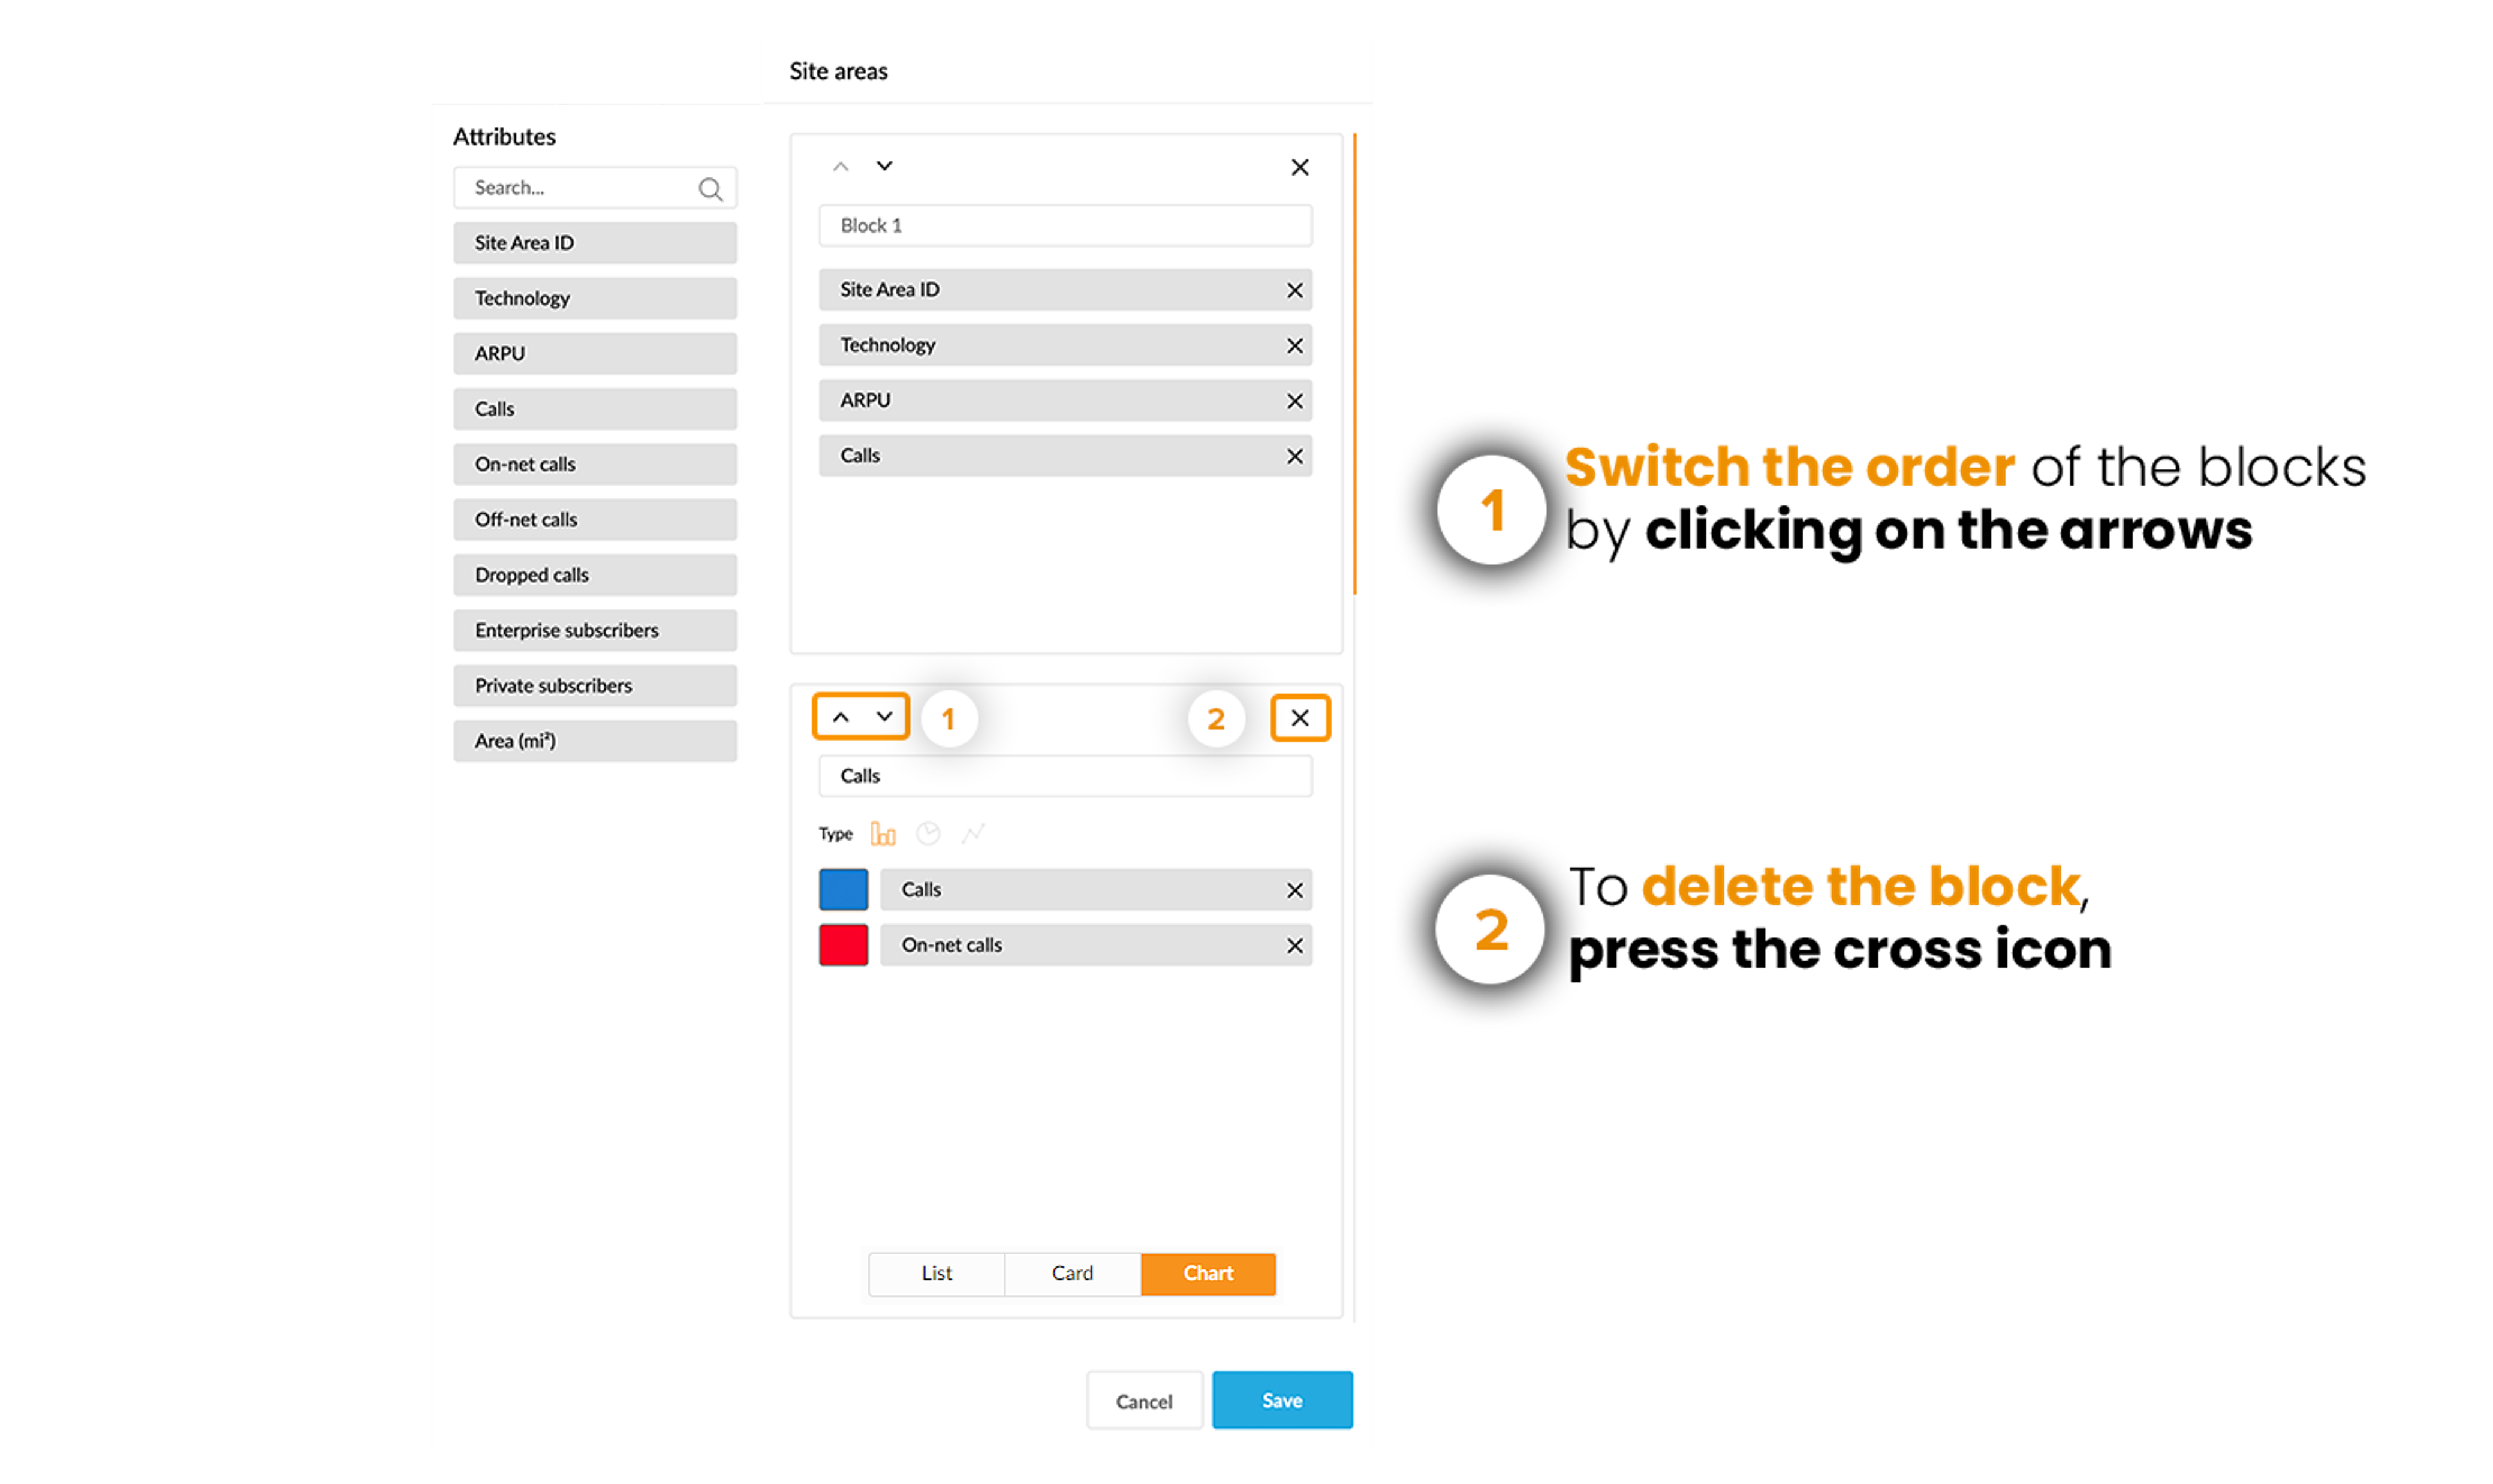
3.1. Configure Dashboard
3.1.1. Temporal Data
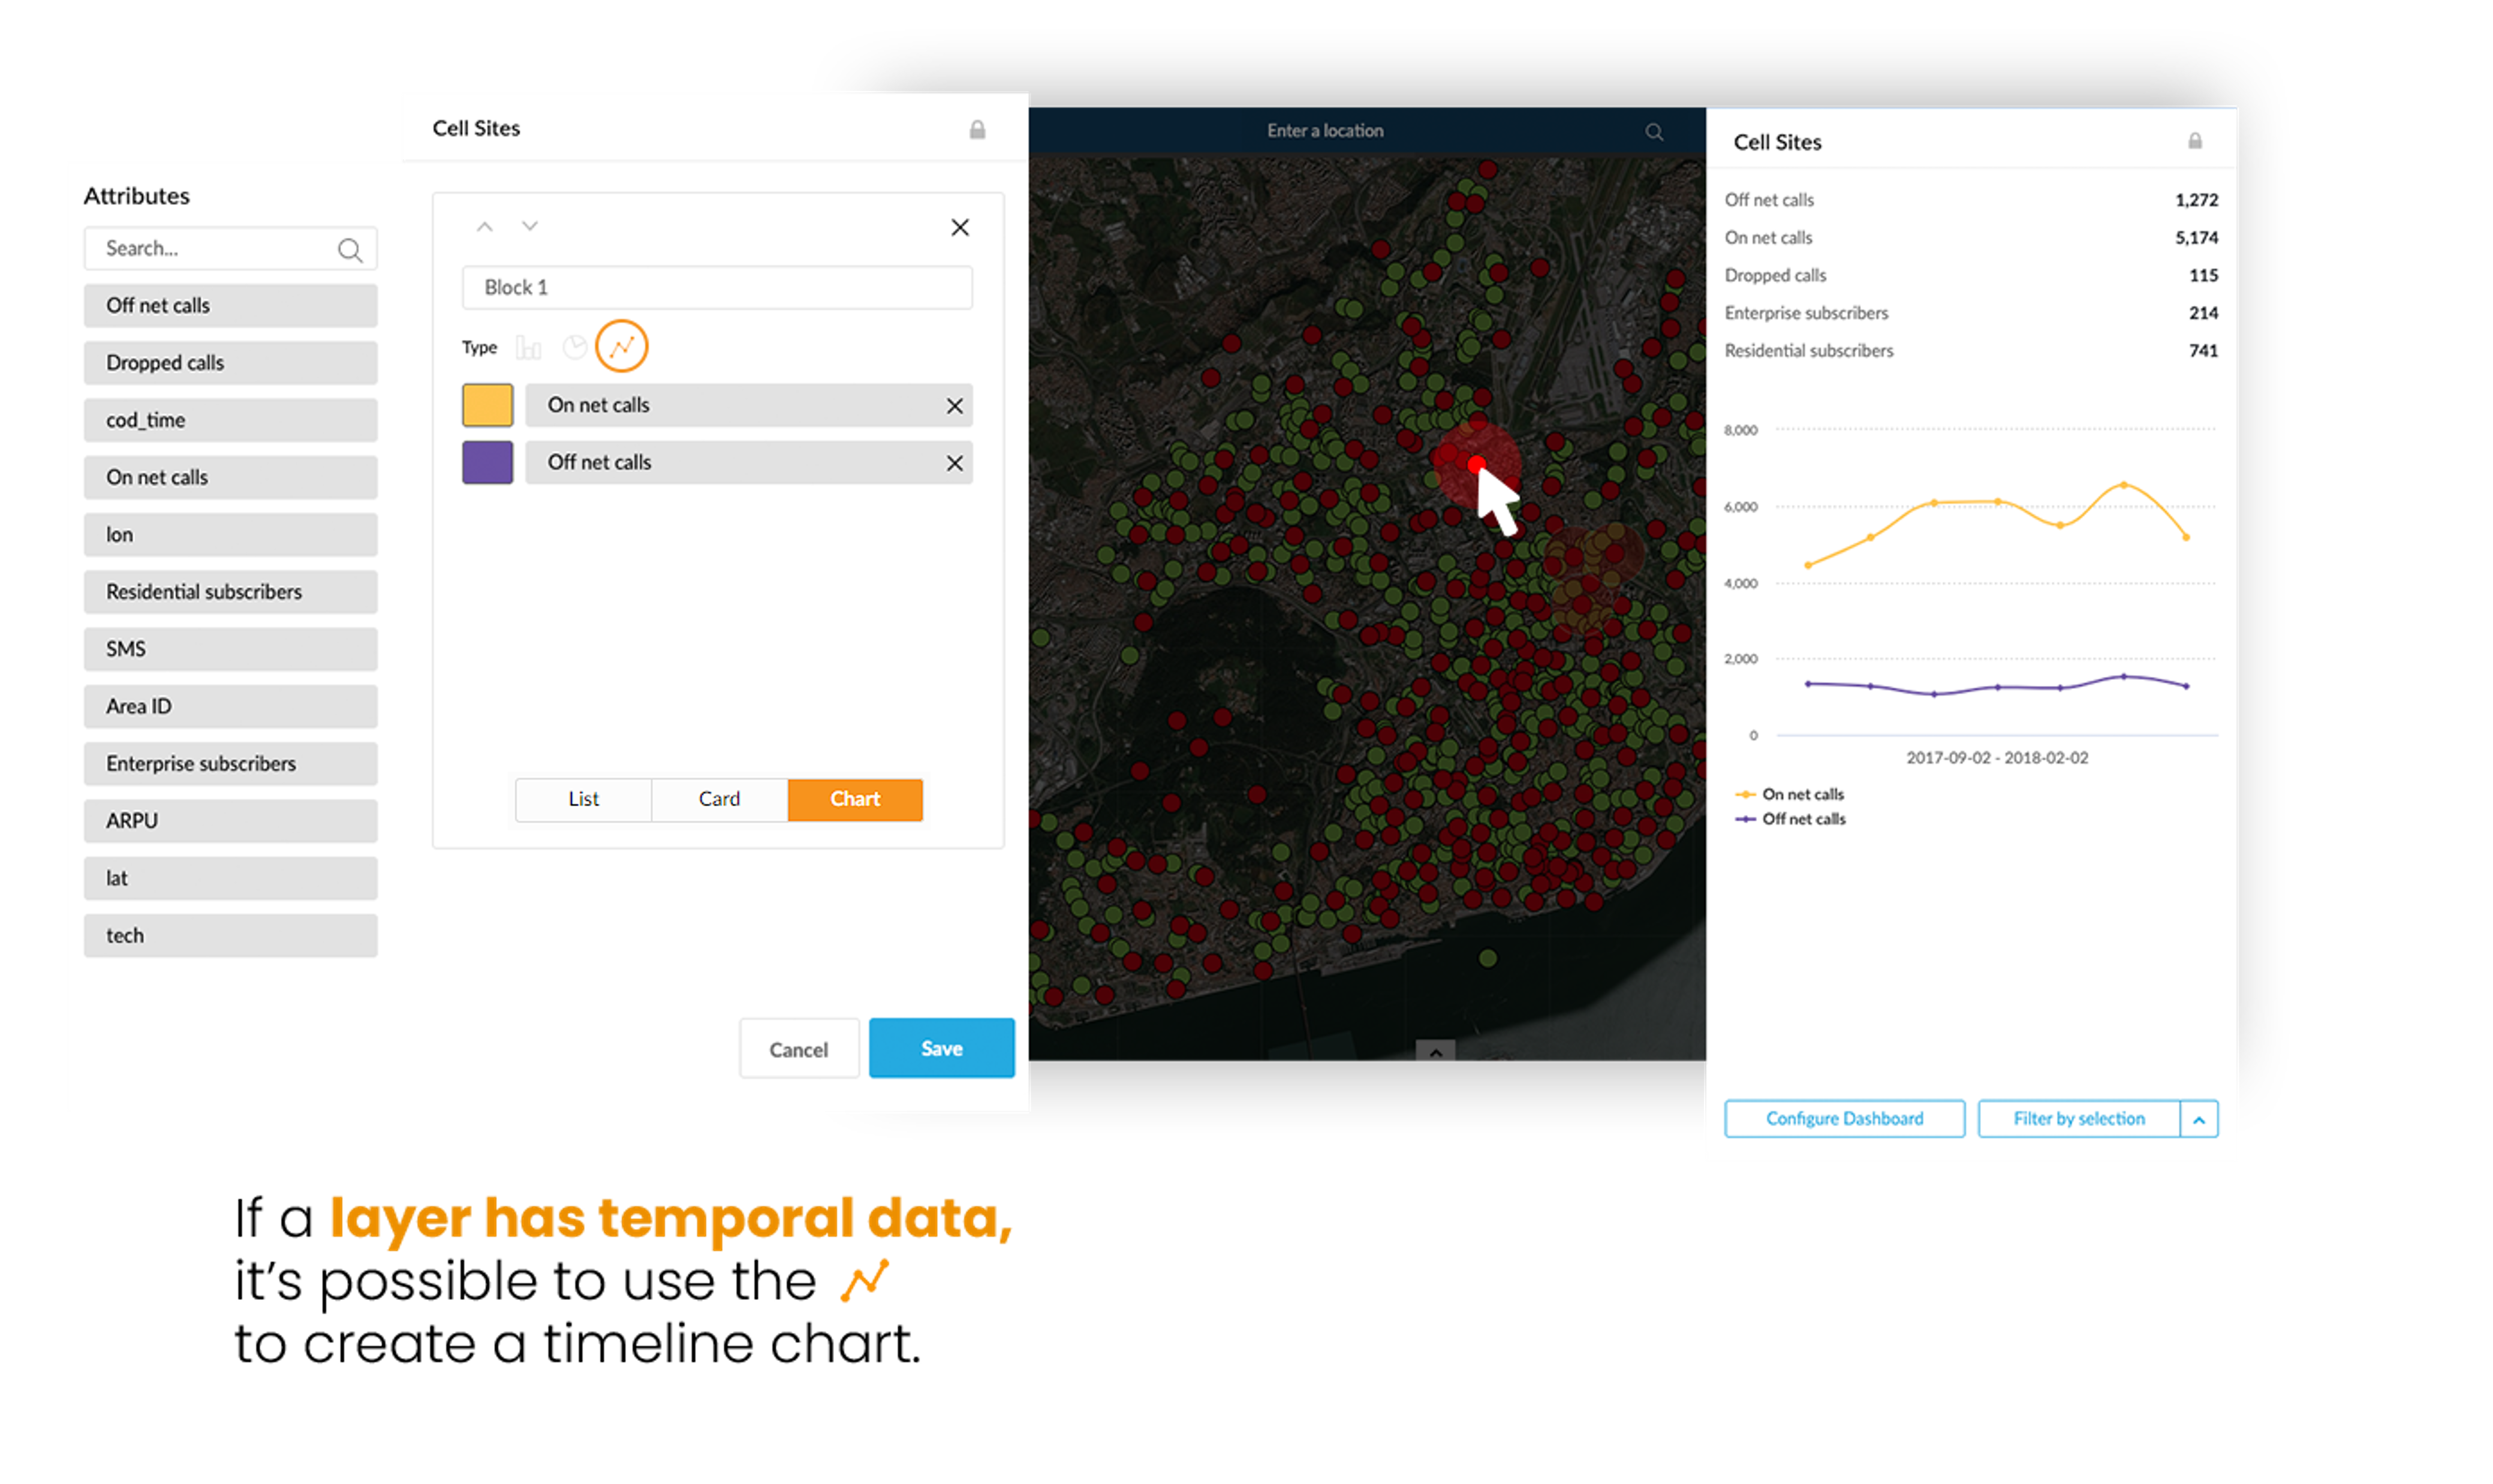
3.1.1.1 YoY - Year on Year charts
The YoY - Year on Year feature in Mapidea allows you to visually compare indicators across two different years, directly on charts.
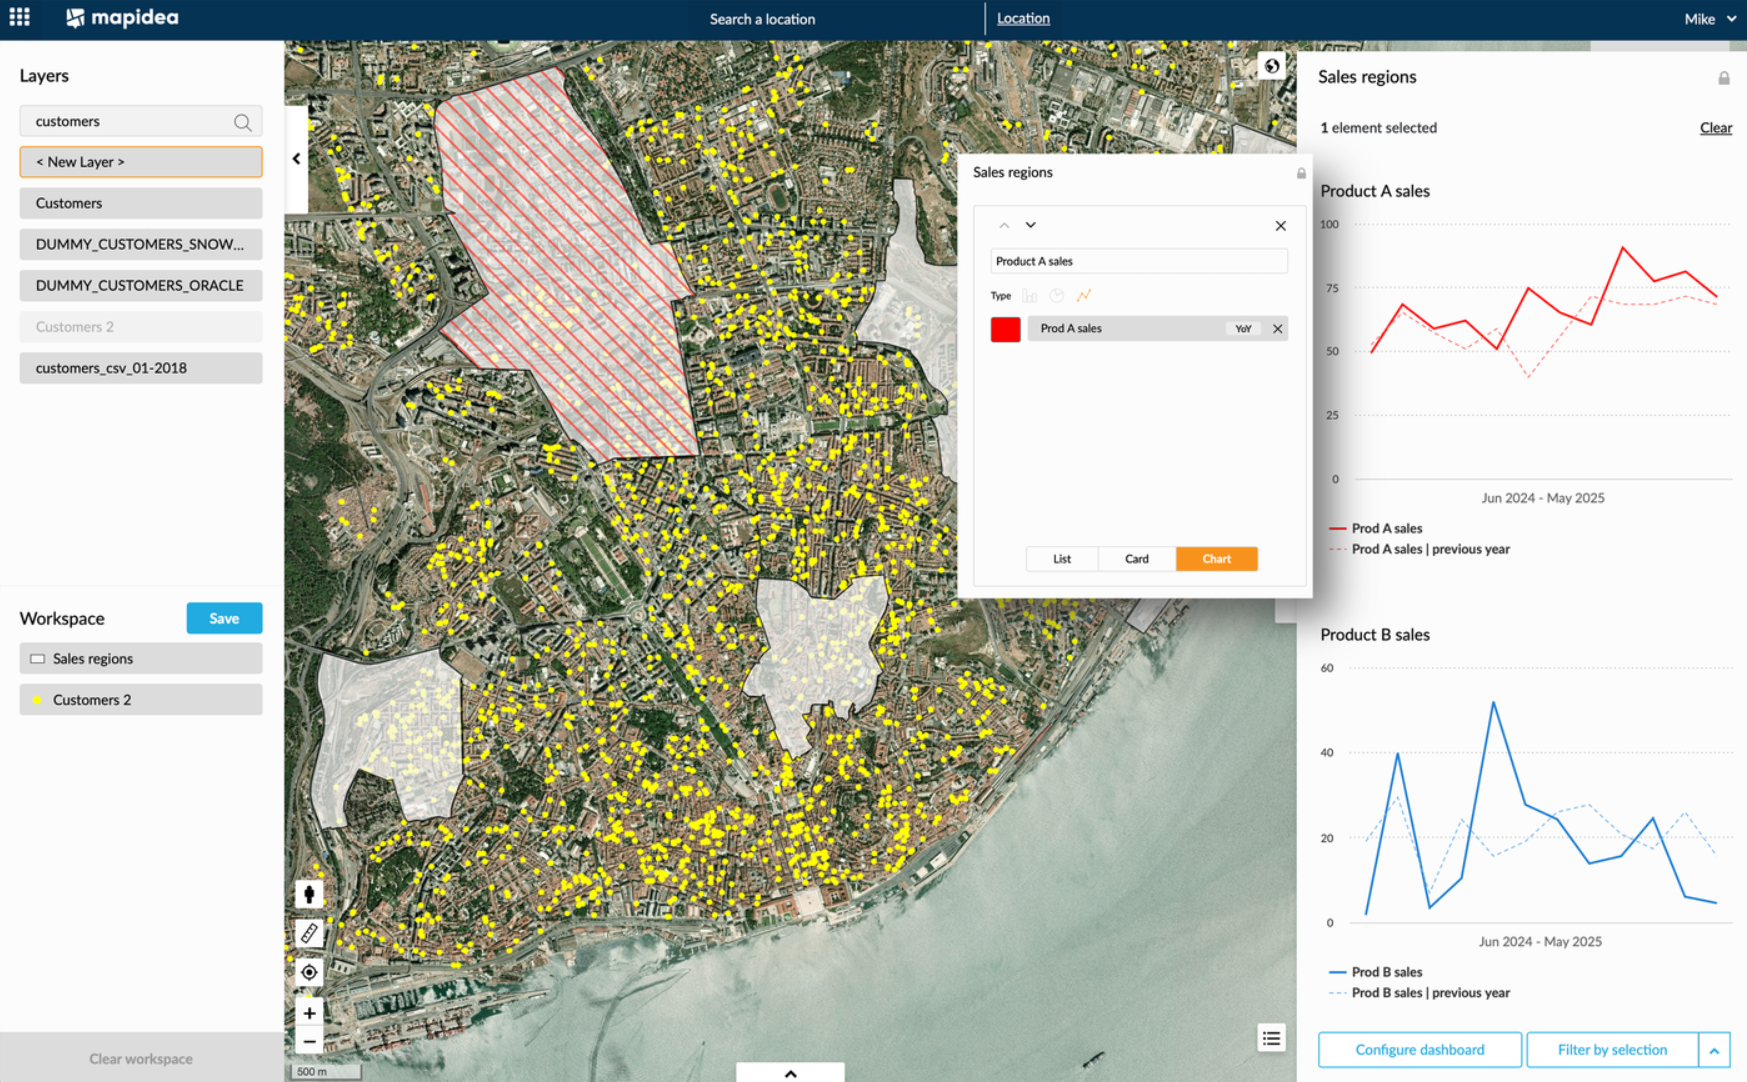
To use YoY charts, you’ll need a layer with temporal data. The layer must contain at least one full year of data to enable a valid year-on-year comparison.
3.2. Dashboard Functionalities
To switch to another dashboard, just click on the layer's name and it shows the list of layers you currently have on your workspace.
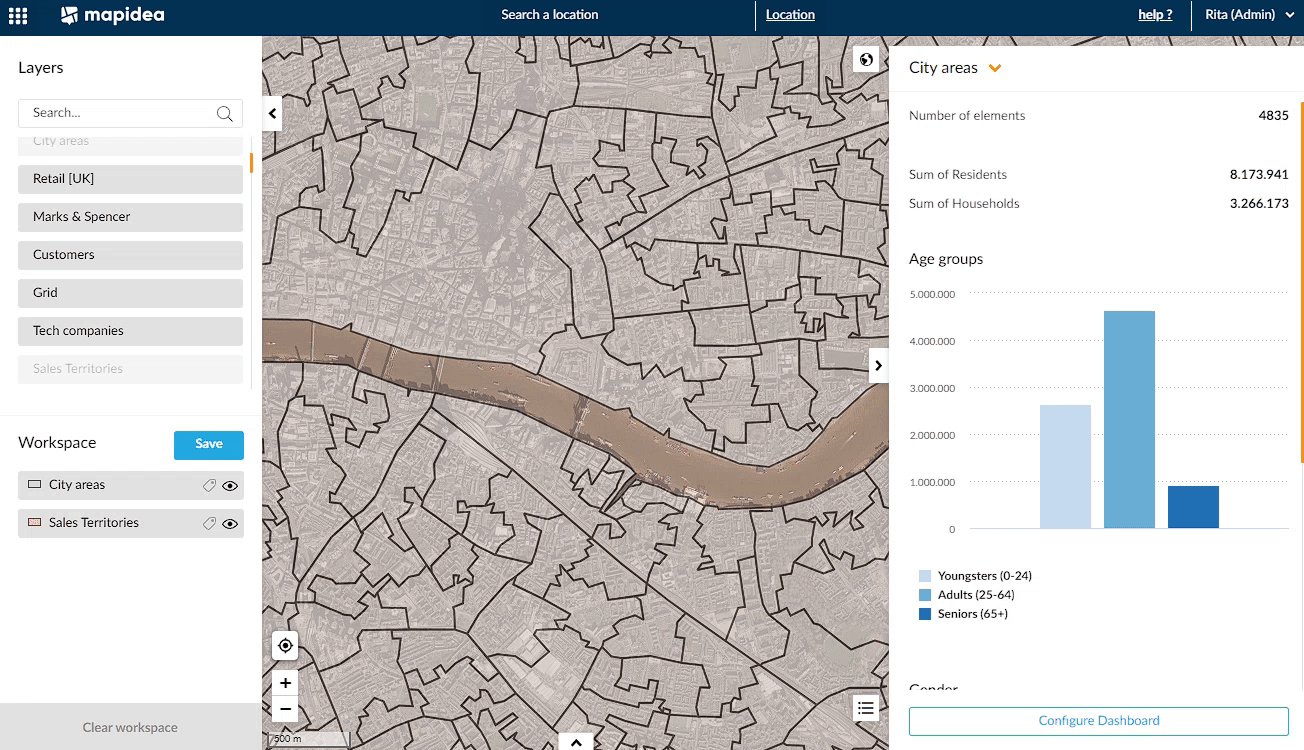
You can also compare dashboards by clicking the lockpick icon and chosing another element. While having the element locked on the dashboard, you can switch to other areas to compare information.
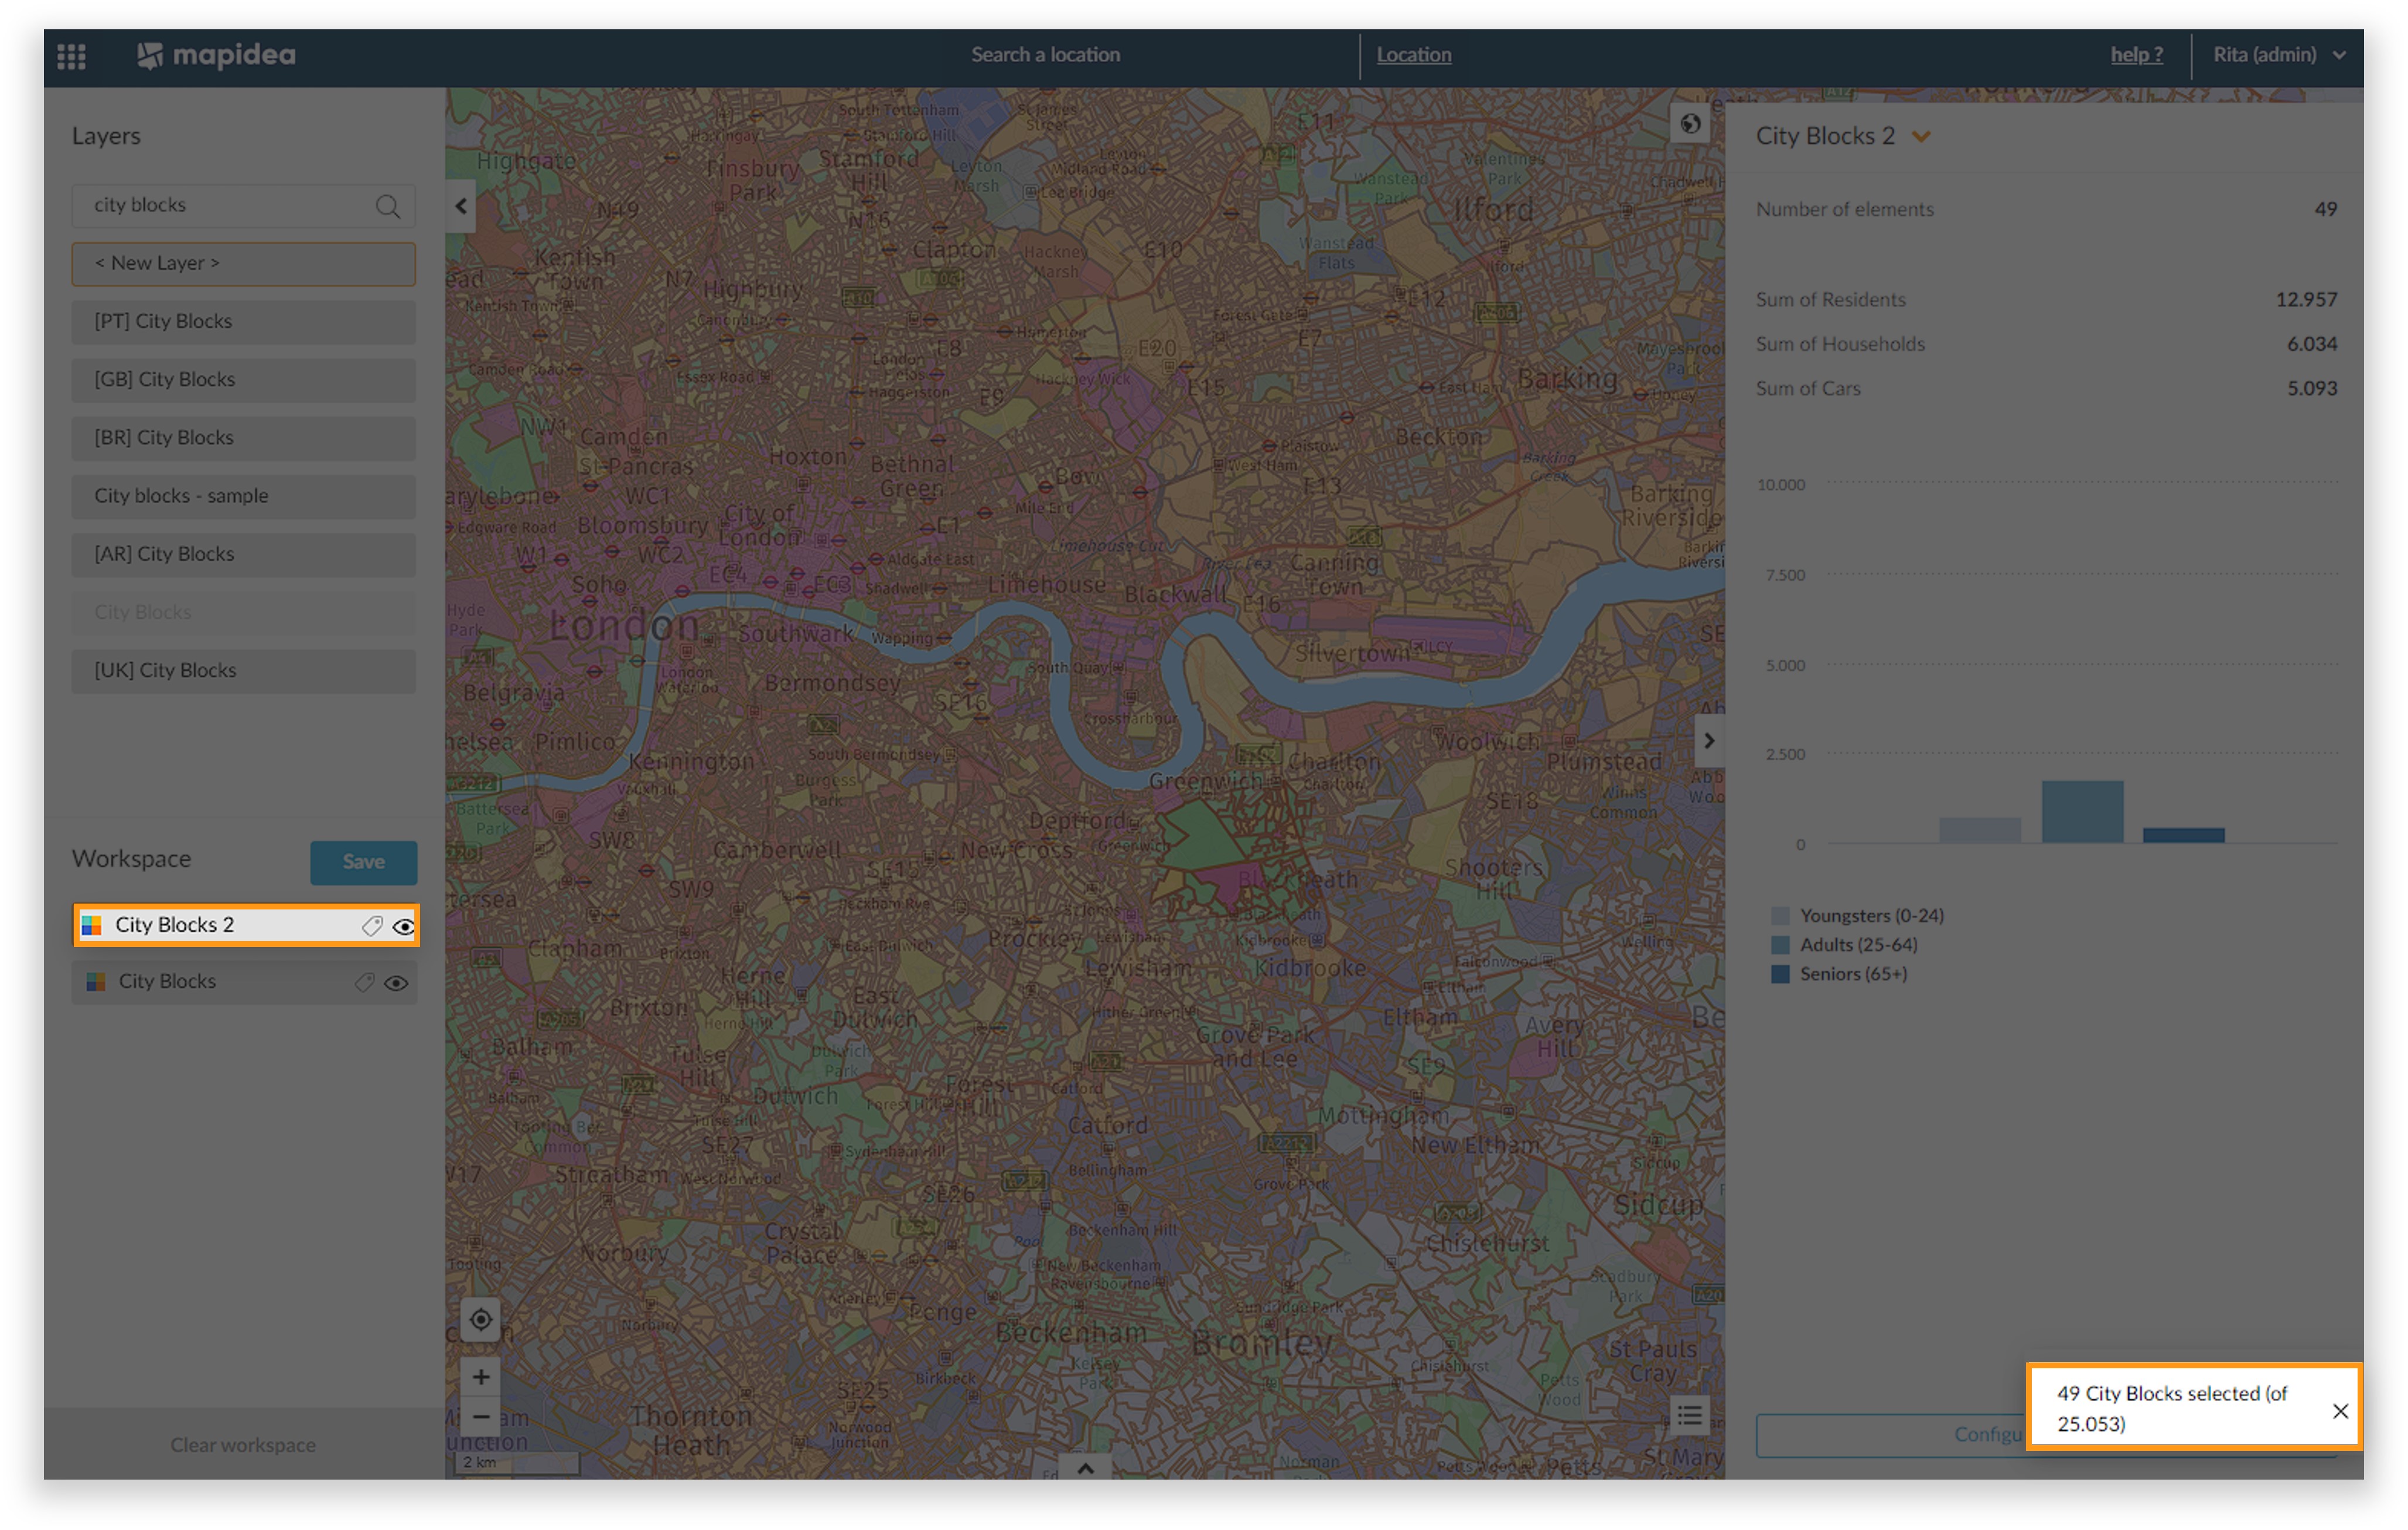
By selecting elements on the map, the dashboard will open and it will be possible to filter the layer (1) or create a new layer with the results of that selection (2).
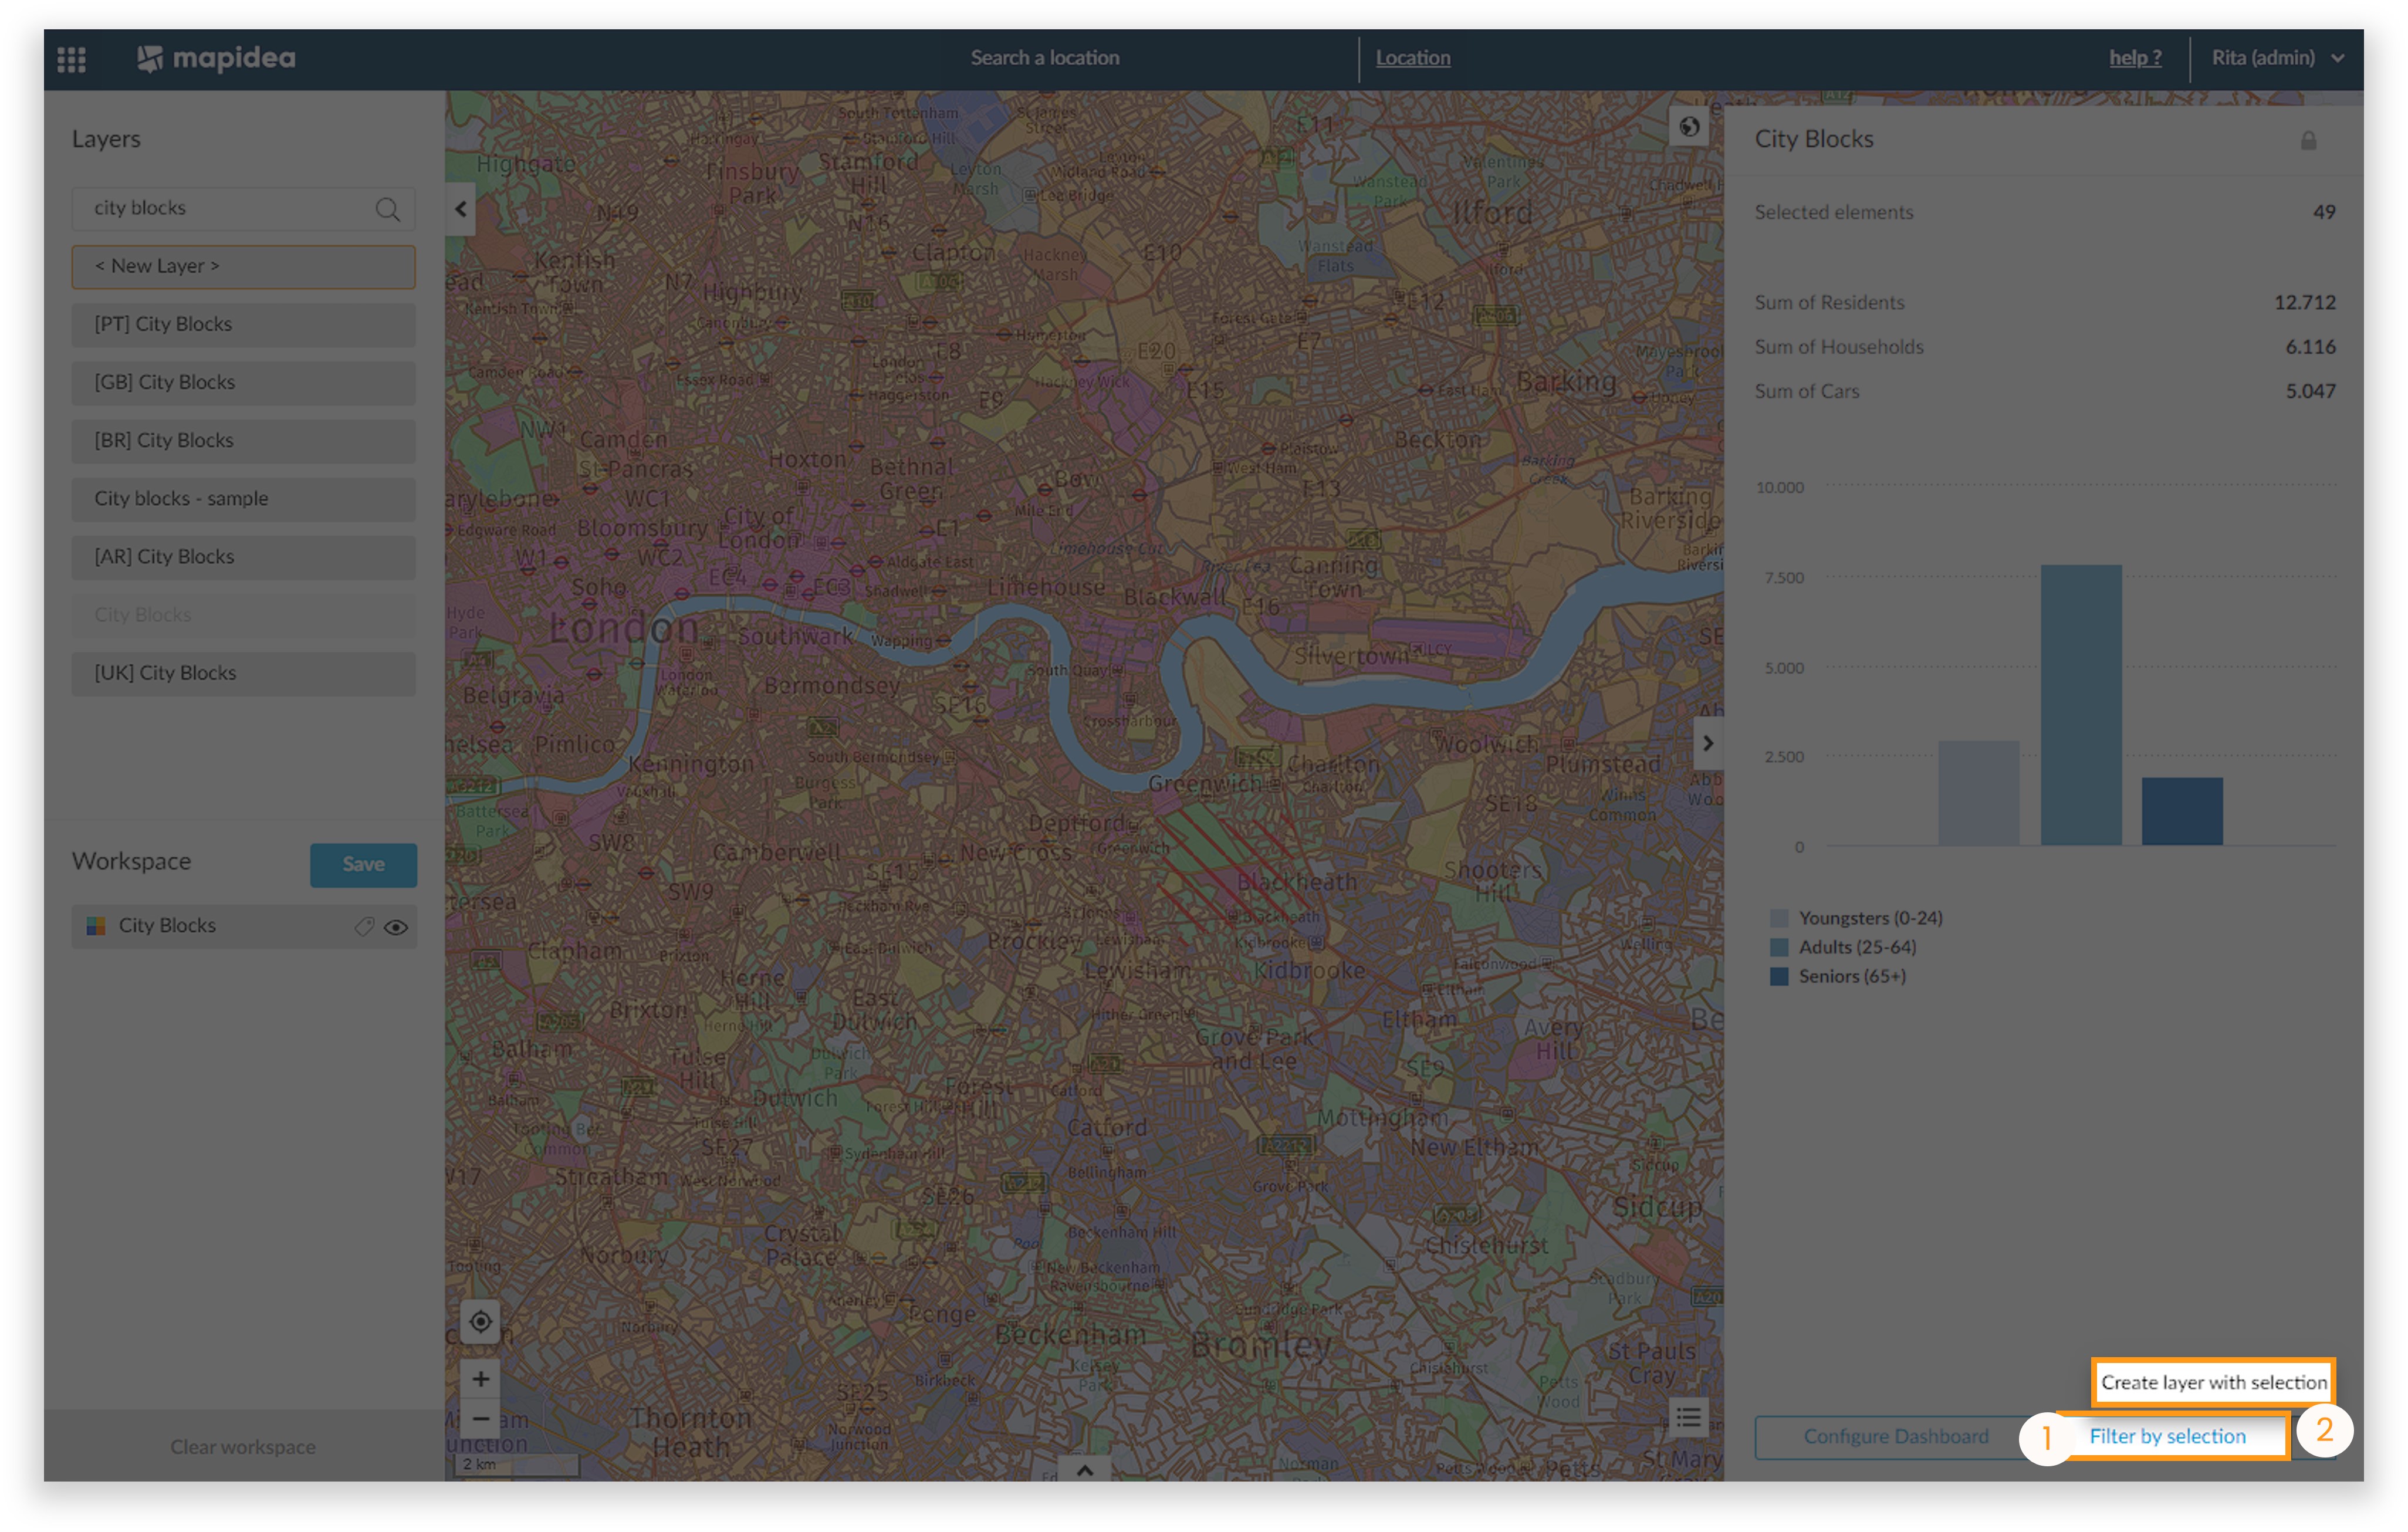
If you select the second option (create new layer), a new layer will appear in the workspace.